☝️ GBP/USD Waiting for Bearish Breakout in Downtrend Channel ☝️
Subscribe
Hi traders,
the GBP/USD is testing the 61.8% Fibonacci retracement level of the wave 2 vs 1. Will the support zone be used for a bullish reversal or will the downtred channel continue lower?
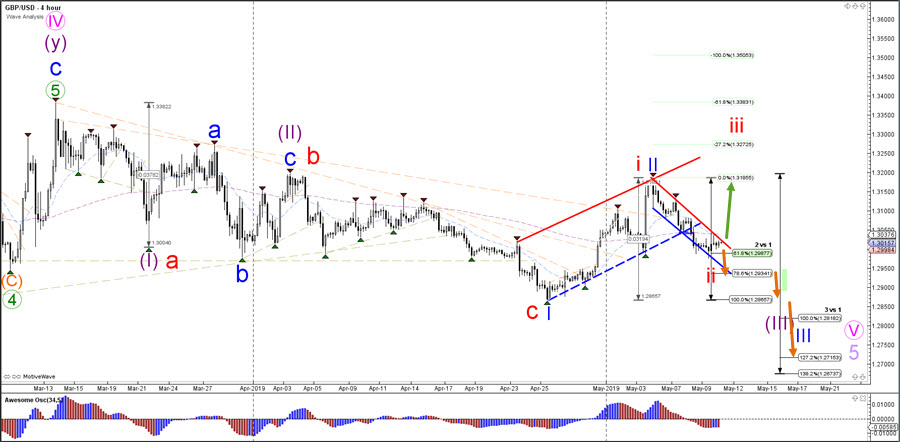
GBP/USD
4 hour
The GBP/USD remains in an indecisive spot from a wave perspective. The main aspect to keep an eye on is whether price bounces or breaks at the top (red) resistance line of the downtrend channel. A bearish continuation, especially below the 100% Fibonacci level, could indicate an impulsive wave 3 pattern whereas a reversal could indicate a bullish wave count instead.
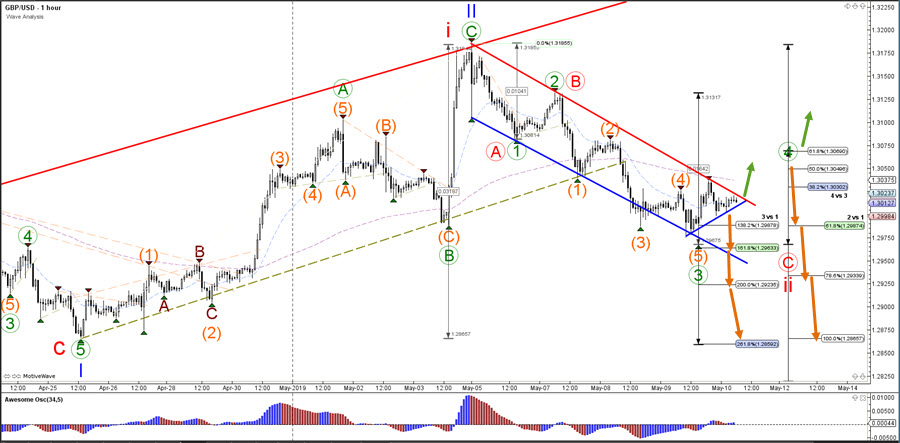
1 hour
The GBP/USD has made a bullish retracement back to the top of the downtrend channel and the 144 ema, which is a key decision for a bearish bounce or bullish breakout. A bearish reaction could indicate a continuation of the wave 3 (green) whereas a breakout could either be part of a larger 4 (green) correction or the start of a new uptrend (green arrow), which will depend whether price can break above the 50-61.8% Fibonacci levels or not. Fro the moment, a bearish breakout seems the most likely scenario.
For more daily wave analysis and updates, sign-up up to our ecs.LIVE channel.
Good trading,
Chris Svorcik
Elite CurrenSea


Leave a Reply