? GBP/USD Strong Bearish Impulse Breaks 1.2425 Support Zone ?
Subscribe
Hi traders,
the GBP is showing weakness this week against a wide range of currencies. The bearish GBP/USD impulse for instance even managed to break below the previous bottom and key support zone at 1.2420-40, which invalidates a larger bullish correction and seems to confirm the continuation of the downtrend.
GBP/USD
4 hour
The GBP/USD seems to have completed a bullish ABC (orange) pattern within wave 4 (green) before the strong bearish momentum broke below the 1.2420 bottom. Despite the break of the bottom, price is still facing a key support trend line (blue) and 61.8% Fibonacci level which could act as a potential bounce spot. A bearish breakout below the support zone could indicate a bearish continuation towards the Fibonacci targets of wave 5 vs 1+3.
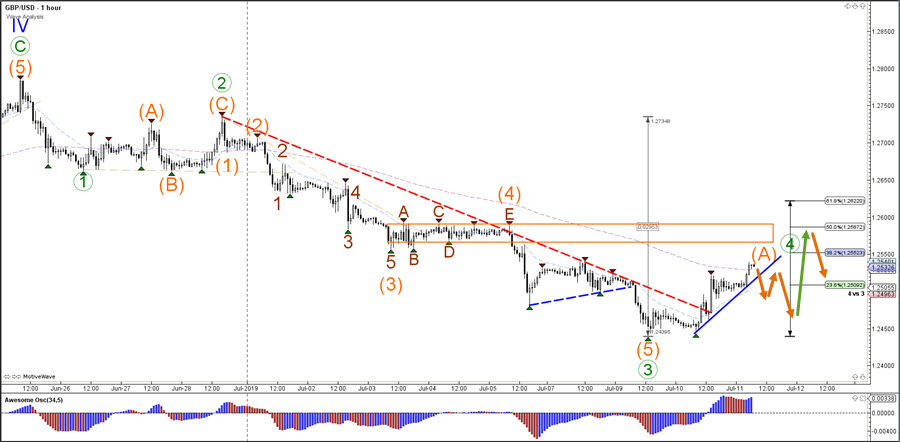
1 hour
If the GBP/USD makes a bullish bounce at this spot, then price might be completing a wave 3 (orange) impulse and expecting a wave 4 (orange) pullback. The Fibonacci levels of wave 4 vs 3 are expected to act as a resistance levels for a bearish bounce and continuation lower. The wave 4 (orange) pattern is invalid if price breaks above the bottom of wave 1 (orange), although a break above the 61.8% Fibonacci makes a wave 4 already less likely.
For more daily wave analysis and updates, sign-up up to our ecs.LIVE channel.
Good trading,
Chris Svorcik
Elite CurrenSea


Leave a Reply