GBP/USD Confirms Bearish 5 Waves ? Awaits Bullish ABC ?
Subscribe
Hi traders,
the GBP/USD broke below the next smaller support trend line (dotted blue) and fell towards the long-term trend line (blue). The bearish momentum is creating a larger reversal (wave 1-2) or ABC retracement (orange).
GBP/USD
4 hour
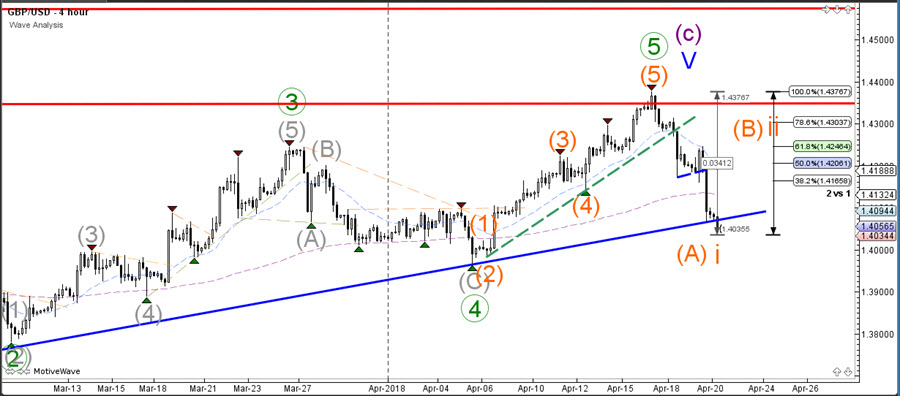
Price however is now close to the 1.40 round level which could create a bullish bounce as part of a wave 2 or B and retrace towards the Fib levels.
1 hour

The GBP/USD is showing strong bearish momentum, which confirmed a 5 wave down. The bearish breakout is probably a wave 5 (brown) of wave A (orange). A bullish bounce could start a bullish wave B retracement.
USD/JPY
4 hour
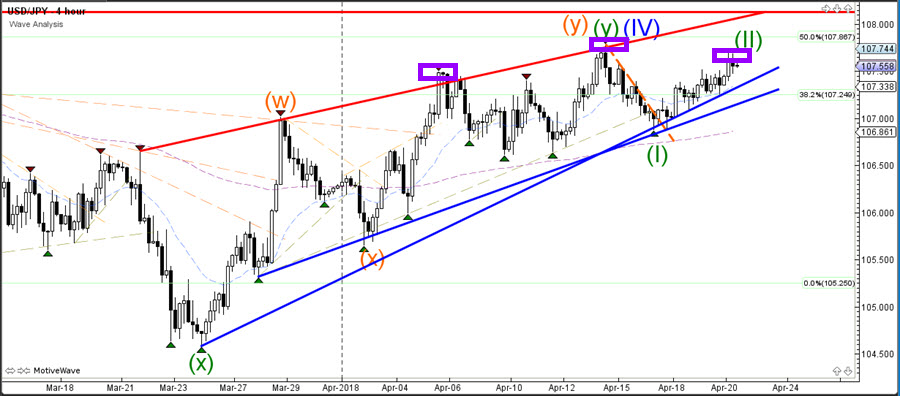
The USD/JPY is testing a key decision zone at the 50% Fib resistance. A bullish break invalidates the bearish wave structure whereas a break below the support trend line (blue) makes a downtrend continuation within wave 5 (blue) more likely. The wave 2 (green) could be aided by a potential head and shoulders pattern, which is indicated by the purple boxes.
1 hour

The USD/JPY could be building a potential wave 2 pullback (orange). This wave pattern is invalidated once price breaks above the 100% Fib level of wave 2, which is indicated by the orange line. A break below the support trend line (green) could indicate more bearish pressure.
Good trading,
Chris Svorcik
Elite CurrenSea
.


This looks very clear and good. Can I suggest that the other analysis of Gold follow this pattern?
Hi there. Sorry i have made the labels bigger now. There was also some technical glitch, which prevented people from expanding the image. I hope it is now possible to expand it. Can you confirm? Thanks
Hubert
Hi Morris, thank you. I have sent a message to Hubert asking if you can make it bigger 🙂