? GBP/USD Bearish Momentum Breaks Wave-4 Pattern ?
Subscribe
Hi traders,
The GBP/USD bearish impulsive price action is testing vital Fibonacci target levels of wave 5 vs 3.
GBP/USD
4 hour
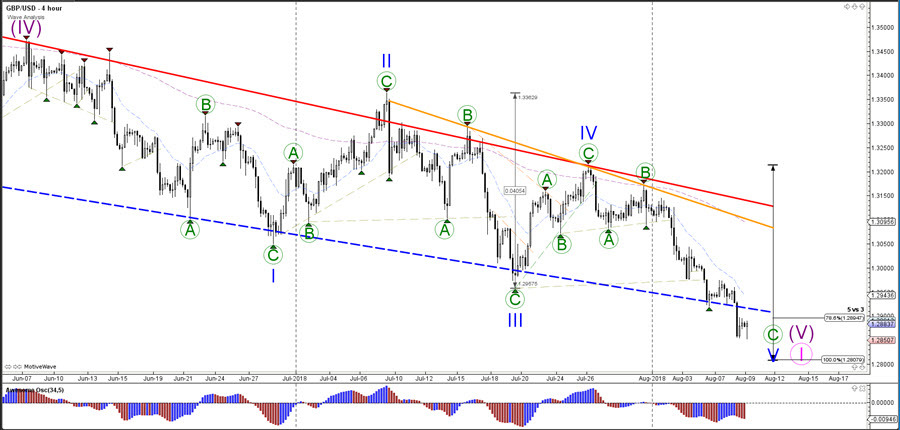
The GBP/USD has broken below the support (dotted blue) trend line of the downtrend channel and is now approaching the 100% Fibonacci target. A break below the Fibs would indicate a different wave pattern because wave 5 (blue) cannot be longer than wave 3 (blue) in an ending diagonal wave pattern. A rebreak back into the downtrend channel could indicate that wave C (green) is completed and a reversal might take place.
1 hour
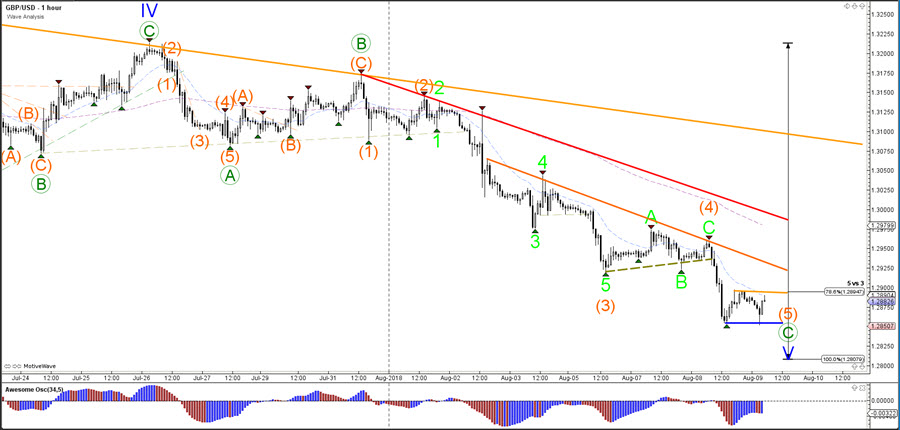
The GBP/USD indeed completed a bullish wave 4 (green) as expected in yesterday’s analysis, after breaking below the support trend line (dotted green). Price could now be building a bear flag chart pattern, which could indicate that a new low is possible. The main target is the 100% Fibonacci level. A bullish break above the resistance trend lines could indicate a larger bullish reversal.
Good trading,
Chris Svorcik
Elite CurrenSea


Leave a Reply