? GBP/USD 100 Pip Bearish Spike Retests Support Zone ?
Subscribe
Hi traders,
the GBP/USD failed to break above the resistance trend line (red) and showed a strong bearish bounce instead. Acorrective WXY (brown) pattern therefore remains dominant. Check out for regular updates, webinars, analysis, and setups in the Forex market via ecs.LIVE.
GBP/USD
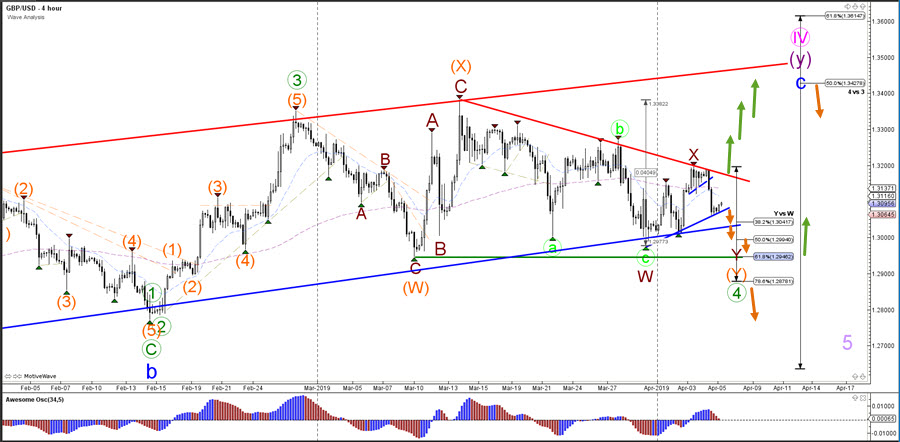
4 hour
The GBP/USD however also remains close to strong support zones and the bearish price action could also be a retest of the trend lines (blue). Brexit news could also send the Cable impulsively in both directions. For the moment it seems likely that price would bounce at support and the Fibonacci levels and then move up to retest the resistance trend line (red).
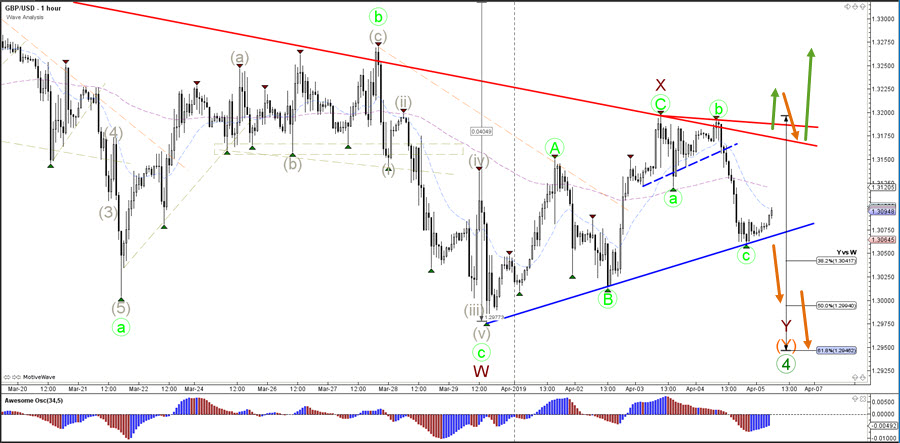
1 hour
The GBP/USD could have completed a bearish ABC (green) zigzag correction at the support trend line (blue). A break below the support could indicate more bearish pressure towards the Fibonacci levels of wave Y vs W where as a break above the resistance (red) could indicate an uptrend.
For more daily wave analysis and updates, sign-up up to our ecs.LIVE channel.
Good trading,
Chris Svorcik
Elite CurrenSea


Leave a Reply