〽️ EUR/USD Triangle Pattern Favors Bearish Swing to 1.1275 〽️
Subscribe
Hi traders,
the EUR/USD is moving sideways after recently confirming a higher high. The corrective price action is expected to develop as a bearish ABC (purple) zigzag pattern within a wave B (pink).
EUR/USD
4 hour
The EUR/USD bullish swing has most likely completed a strong, impulsive wave A (pink) and price is expected to show another bullish swing after completing a bearish ABC retracement (purple). The Fibonacci levels of wave B vs A are therefore expected to act as potential support level for a bullish reversal.

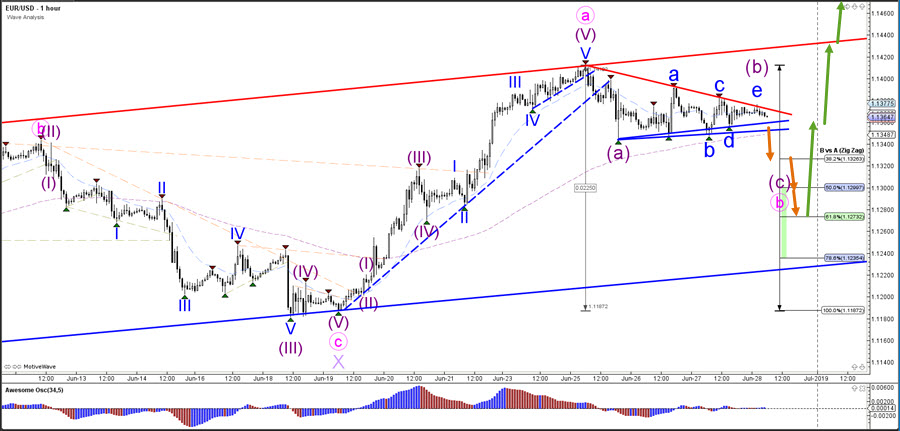
1 hour
The EUR/USD seems to have completed an ABCDE (blue) triangle chart pattern within wave B (purple). For the moment, a bearish breakout seems more likely and a push below the support zone (blue lines) could confirm the bearish push lower. A bullish breakout however could either indicate a deeper wave B (purple) or a new uptrend.
For more daily wave analysis and updates, sign-up up to our ecs.LIVE channel.
Good trading, Chris Svorcik


Leave a Reply