❗️ EUR/USD Testing 78.6% Fibonacci Support at 1.08 ❗️
Subscribe

Dear traders,
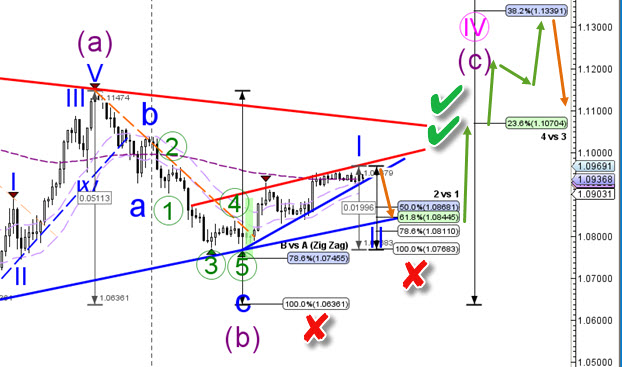
the EUR/USD made a bearish breakout below the rising wedge chart pattern after completing a potential leading diagonal in wave 1 (blue). The retracement is now testing the Fibonacci levels of wave 2 vs 1.
EUR/USD
4 hour chart
The EUR/USD made a bullish bounce at the 78.6% Fibonacci retracement level of wave 2 vs 1. This could confirm the development of a wave 1-2 (blue) pattern. The next confirmation (green checks) would take place if price is able to break above the resistance trend line (red). A break below the bottom and 100% Fibonacci support levels invalidates (red x) this bullish outlook.
The analysis has been done with SWAT method (simple wave analysis and trading).
For more daily technical and wave analysis and updates, sign-up up to our newsletter.
Good trading,
Chris Svorcik
Elite CurrenSea


Leave a Reply