? EUR/USD Testing 61.8% Fibonacci Support of Wave 4 ?
Subscribe
Hi traders,
the EUR/USD made a bearish retracement yesterday. Will price break below the Fibs of wave 4 for a downtrend or will price make a bounce and retest the resistance trend lines?
EUR/USD
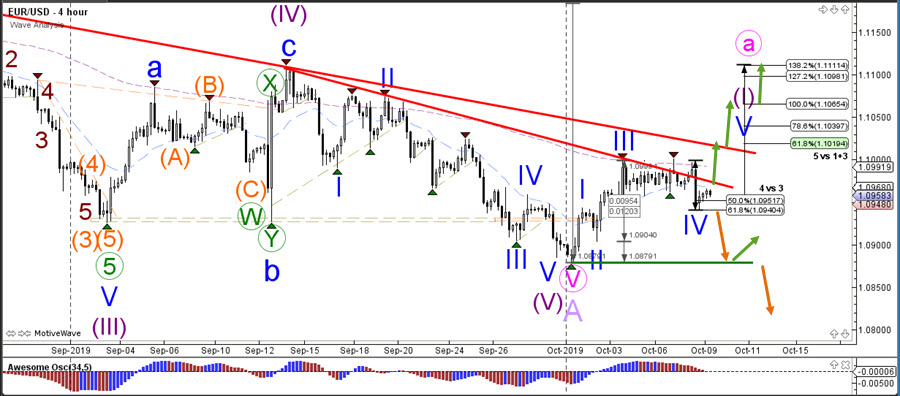
4 hour
The EUR/USD is in a difficult spot with support and resistance levels squeezing price into a range. A bullish bounce is possible if price stays above the 61.8% Fibonacci retracement level of wave 4 vs 3 whereas a bearish breakout could see price make a fall to test the previous bottom.
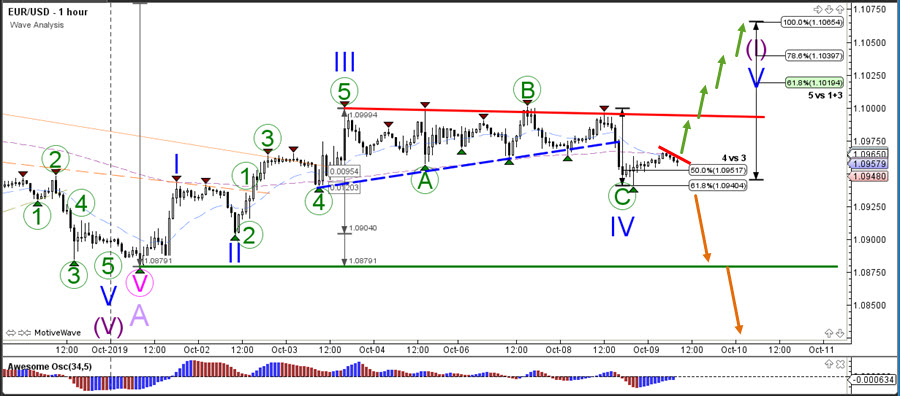
1 hour
The EUR/USD break above the resistance trend line (red) could send the pair higher to test the previous tops. A break above the key decision zone at 1.0975-1.10 could indicate more bullishness and a potential wave 5 (blue). This remains valid as long as price stays above the 61.8% Fibonacci level. A break below that Fib invalidates the current wave 4 (blue) pattern.
For more daily wave analysis and updates, sign-up up to our ecs.LIVE channel.
Good trading, Chris Svorcik


Leave a Reply