? EUR/USD Bulls and Bears Defend Key Zone at 1.1075 ?
Subscribe
Hi traders,
the EUR/USD’s reaction at the double bottom and potential bullish reversal at the 78.6% Fibonacci level of wave B (blue) is extremely slow and choppy. Will the EUR/USD break below the support for a new downtrend?
EUR/USD
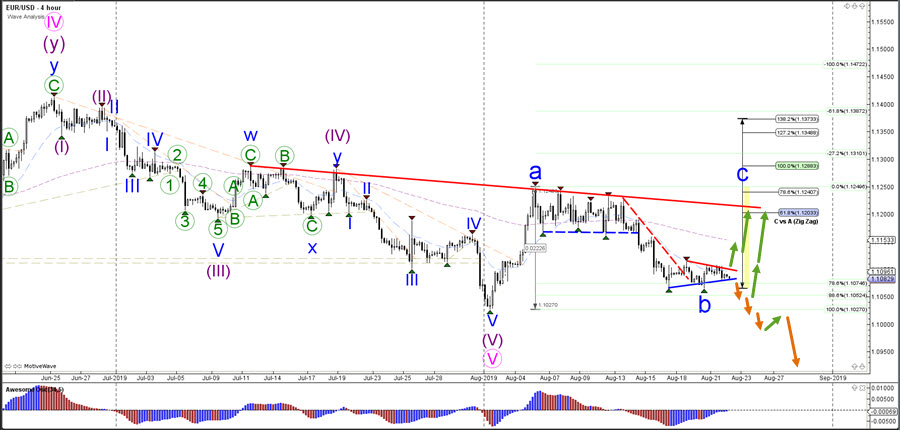
4 hour
Despite Wednesday’s FOMC statement, the EUR/USD hardly moved up or down and price is building a triangle chart pattern as a sign of indecision. The lack of a clear bullish bounce is making a bearish breakout more likely BUT price still faces support at the 88.6% Fibonacci at 1.1050 and the previous bottom at 1.1025. Price will need to break below these levels before a downtrend is likely otherwise a bullish break above the resistance line (red) could spark a rally.
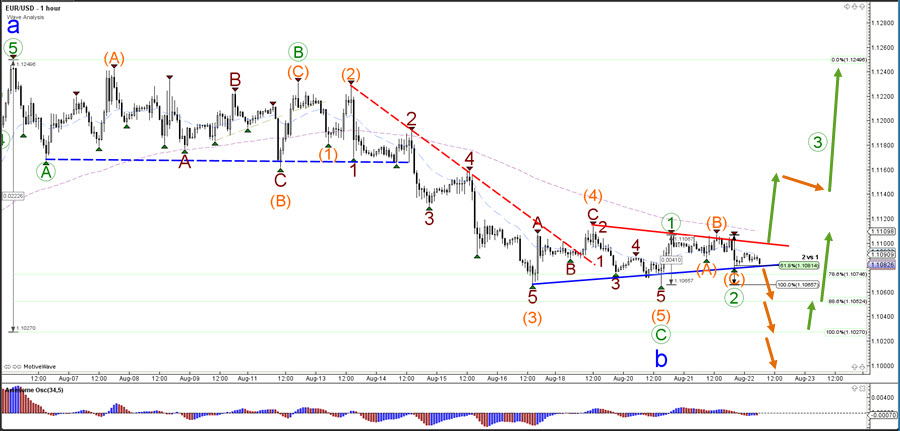
1 hour
The EUR/USD could be building a wave 1-2 (green) pattern as long as price stays above the 100% Fibonacci level of wave 2 vs 1 otherwise a larger bearish correction or new downtrend could be taking place. A break above the resistance line (red) however is needed before price could be building a potential wave 3 (green). A break below the 88.6% and 100% Fibs indicate a downtrend.
For more daily wave analysis and updates, sign-up up to our ecs.LIVE channel.
Good trading, Chris Svorcik


Leave a Reply