🔥 Nasdaq’s Triple Bottom Could Confirm Reversal in Uptrend 🔥
Dear traders,
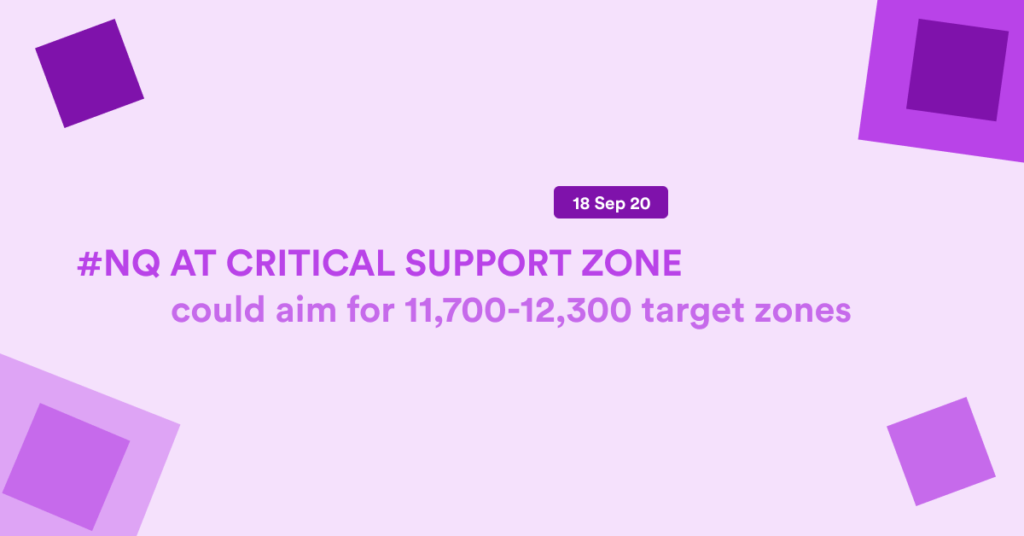
the Nasdaq (NQ 100) is testing the support zone for the 3rd time (top blue box). Will the NQ100 index finally make a bullish bounce? Or will the pullback retrace deeper towards the next support zone?
Price Charts and Technical Analysis
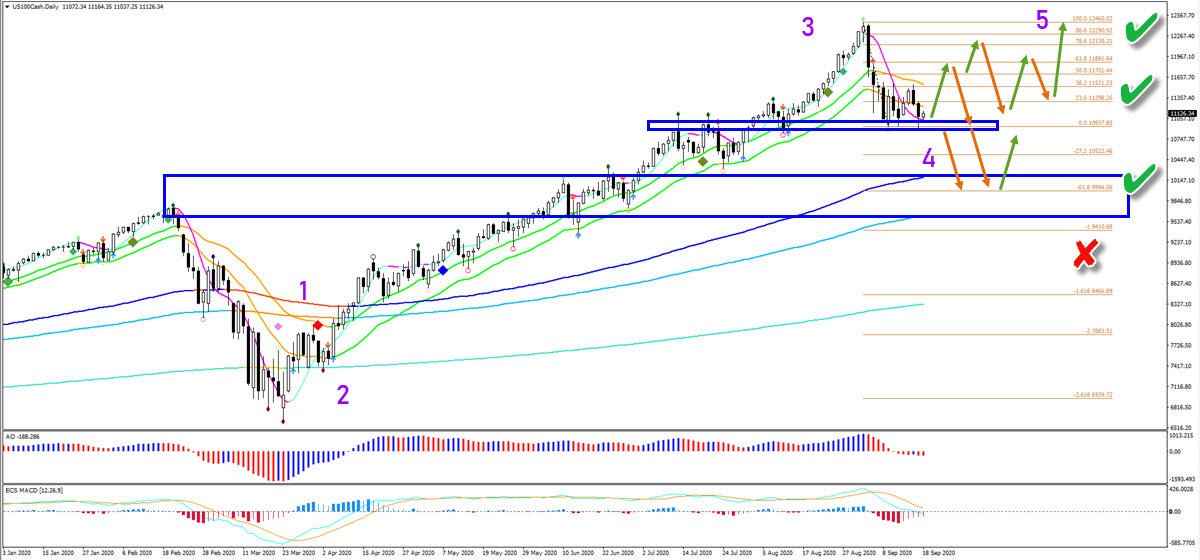
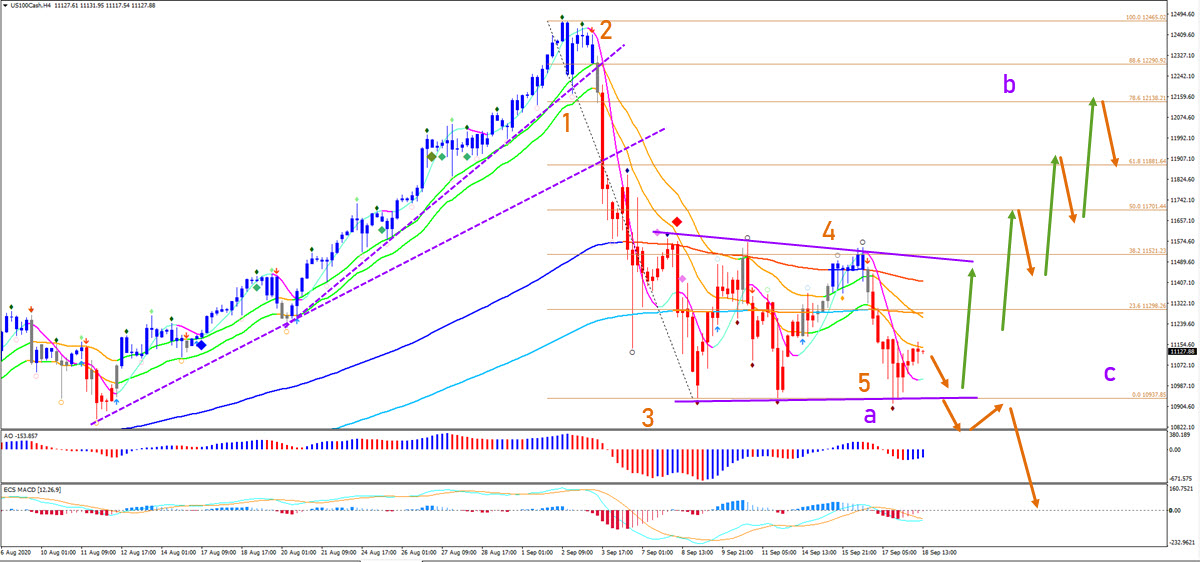
The NQ 100 is likely to make a bullish bounce in this zone due to the strong confluence of support. A bullish bounce would aim for the Fibonacci retracement levels. A push to and reversal at the 50-61.8% Fibonacci retracement levels, however, could indicate a bearish reversal. A move up into the 78.6% indicates a triangle chart pattern instead and later on, an uptrend continuation as well. Only a break below the bottom could increase the chance of price reaching the next support zone (lower blue box) and the -61.8% Fibonacci target. A break below the -1% Fib invalidates the current uptrend.
The current momentum is down according to our Elliott Wave software (red candles) but there is a potential triple reversal chart pattern in play. Only a break below the bottom could actually lead to a larger downtrend. Otherwise a mild pullback could confirm a bullish reversal and breakout towards the Fibonacci resistance levels.
The analysis has been done with the indicators and template from the SWAT method (simple wave analysis and trading). For more daily technical and wave analysis and updates, sign-up to our newsletter.
Good trading,
Chris Svorcik


Leave a Reply