? Nasdaq Bearish Price Action Remains Pullback in Uptrend ?
Dear traders,
the NASDAQ (NQ – US100) chart has almost doubled in value since the major decline in March 2020. The strong uptrend outperforms other stock indices by a large margin. Are the tech stocks in a bubble or is there space for more uptrend?
Price Charts and Technical Analysis
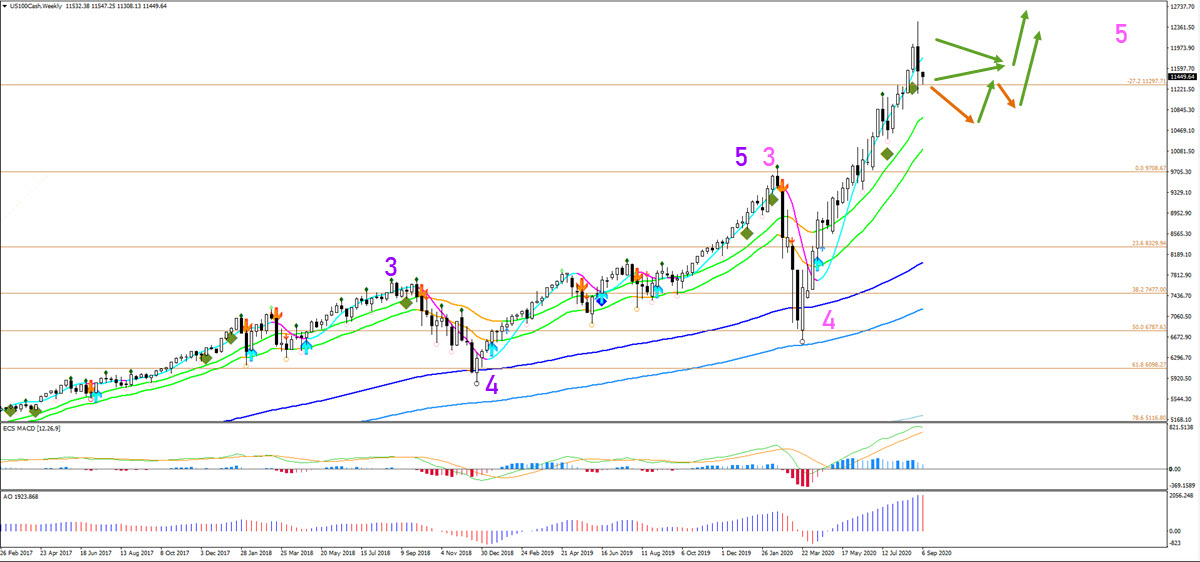
The NQ weekly chart (see above) is showing very strong bullish momentum (green diamonds). Weekly and monthly candles are loose and away from the 21 ema zone, which indicates strong bullish control. The decline in March 2020 is probably a wave 4 (pink) retracement to the 50% Fibonacci level. The current uptrend, however, seems incomplete after breaking above the -27.2% Fibonacci target. The next -61.8% Fibonacci target is located at 13,300. That said, the bearish weekly candle of last week does indicate that a bearish pullback of some sort is likely to take place within the uptrend.
The daily chart (see below) is in a neat and well balanced uptrend channel. Price action is now at the bottom of the channel and the 23.6% Fibonacci level. This could cause a bullish bounce. But the bearish price action could signal the start of an ABCDE triangle pattern (orange) within the wave 4 (purple). A retracement could reach deeper Fibonacci levels and still be part of the wave 4 (purple). A bullish continuation is expected once price action completes the pullback.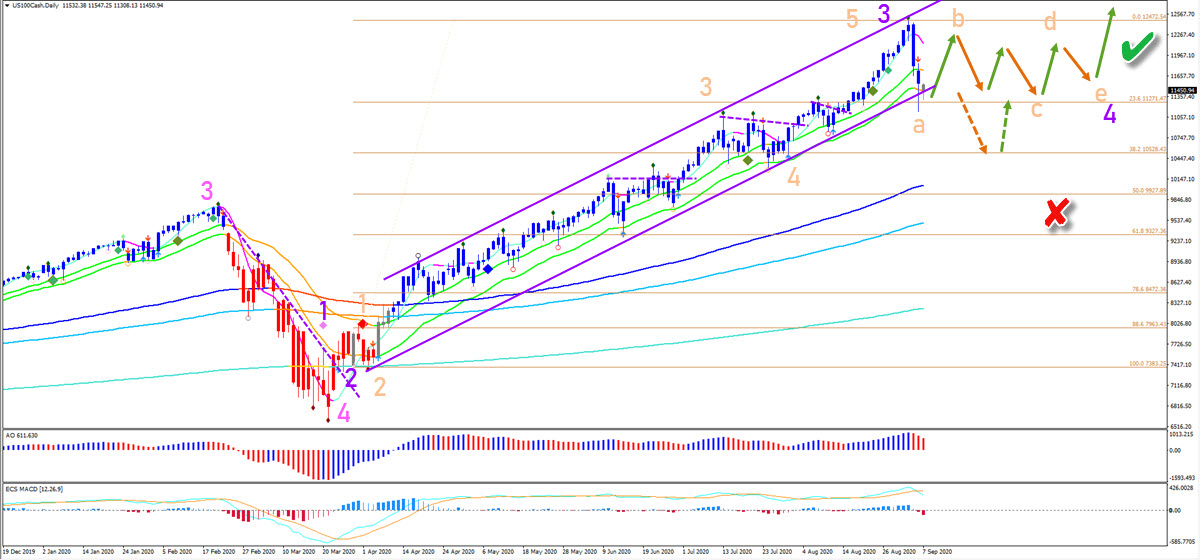
The analysis has been done with the indicators and template from the SWAT method (simple wave analysis and trading). For more daily technical and wave analysis and updates, sign-up to our newsletter.
Good trading,
Chris Svorcik


Leave a Reply