? Zeus EA Back-Tested 4.5 Years on EUR/USD 5 Min Chart ?
Hello Trader,
do you ever wonder whether a 5 minute strategy can be profitable for more than one, two, or even five years?
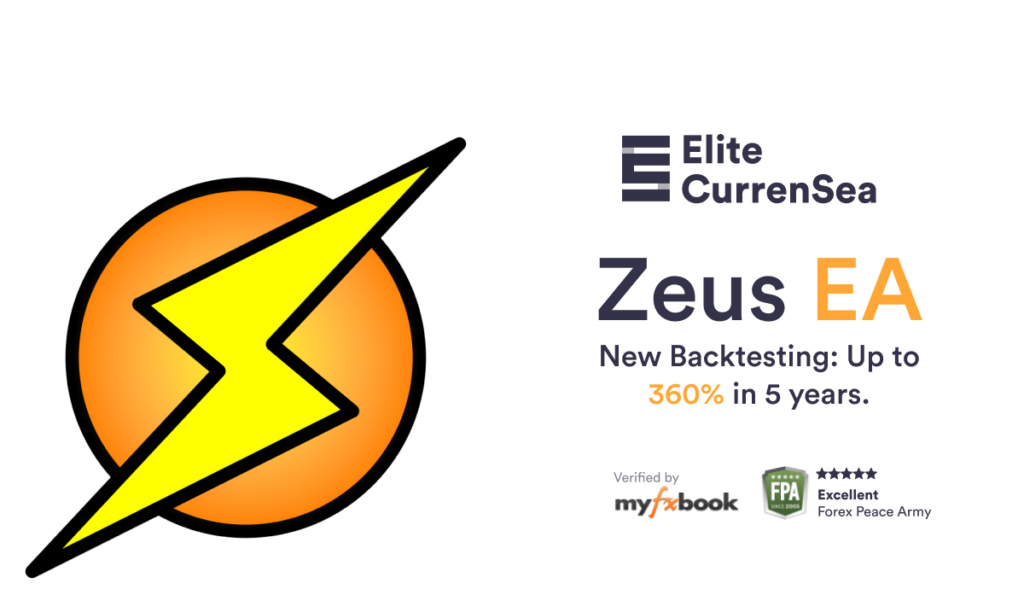
The ECS team has just completed almost 5 years (!) back-testing on the EUR/USD 5 minute (!) chart. The results of the Zeus EA will surely not disappoint.
This article reviews the stats of the lengthy and accurate testing but also provides an update of the real and live trading in recent weeks. (Just in case: the Zeus EA is our newest 100% fully automated trading system that offers a consistent monthly approach with mostly low drawdowns.)
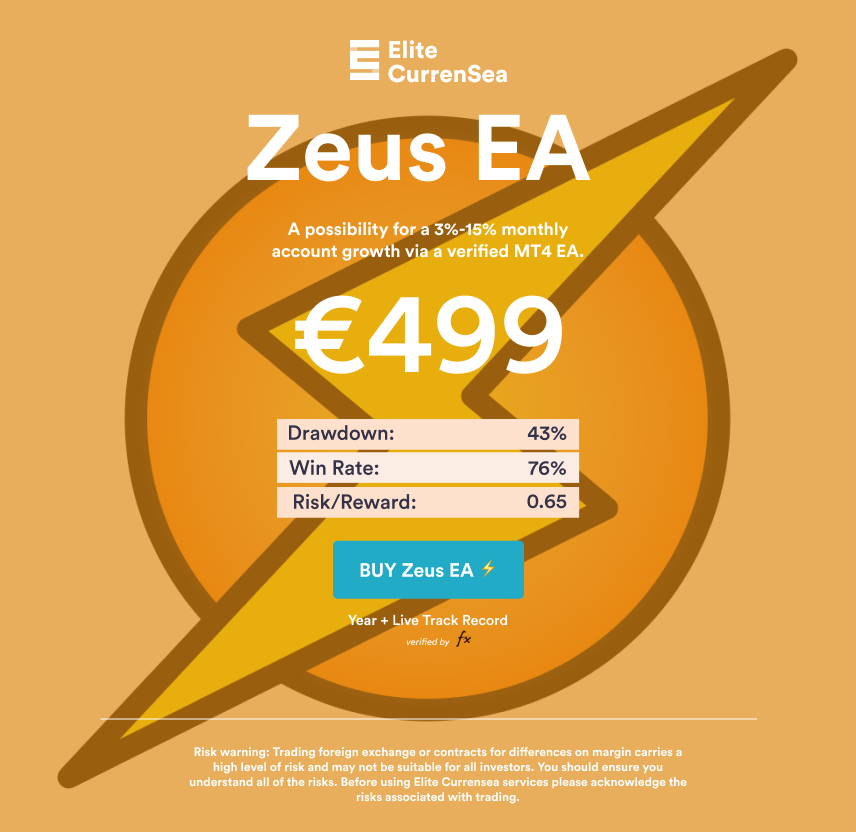
Zeus EA Gains 90-360% with 70% Win Rate
The Zeus EA has been back-tested for a total of four years and seven months from January 2016 to July.2020. The testing was completed using a 5 minute chart on the EUR/USD.
The Zeus EA managed to gain almost 80% per year (79.2%) in this test.
That is 6.6% per month.
These results were achieved with the riskiest approach. This occurs when we trade the minimum lot size (0.01) with the lowest recommended capital ($2,500). On the other side, this does create a larger draw-down.
Here is a full overview:
| Capital $ or € | Gain $ or € | Total gain % | Avg profit per year | Avg profit per month | Myfxbook draw-down | Possible draw-down |
| 2,500 | 9,079.54 | 363.2% | 79.2% | 6.6% | 57.6% | 75.5% |
| 3,500 | 9,079.54 | 259.4% | 56.6% | 4.7% | 40.3% | 53.9% |
| 5,000 | 9,079.54 | 181.6% | 39.6% | 3.3% | 28.8% | 37.8% |
| 10,000 | 9,079.54 | 90.8% | 19.8% | 1.7% | 14.4% | 18.9% |
As you can see from the table above, the absolute gain remains the same because the testing was completed with the smallest lot size (0.01 – one micro). The relative gain does change depending on how much capital is allocated to one micro. Here is how that works:
- If you traded one account with one micro lot with a starting capital of 2,500, then your gain would be 9,079.54 which is a total of 363%. That equals 79% per year and 6.6% per month with a myfxbook draw-down of 57.6%.
- If you traded one account with one micro lot with a starting capital of 3,500, then your gain would be the same 9,079.54 but the relative gain goes down to 259%. That equals 56% per year and 4.7% per month with a maximum draw-down of 40.3%.
- If you traded one account with one micro lot with a starting capital of 5,000, then your gain would be the same 9,079.54 but the relative gain goes down to 181%. That equals 40% (39.6) per year and 3.3% per month with a maximum draw-down of 28.8%.
- If you traded one account with one micro lot with a starting capital of 10,000, then your gain would be the same 9,079.54 but the relative gain goes down to 91%. That equals 20% (19.8) per year and 1.7% per month with a maximum draw-down of 14.4%.
Can I Find the Back-Testing on MyFxBook?
Yes, the results have been uploaded to the ECS myfxbook account.
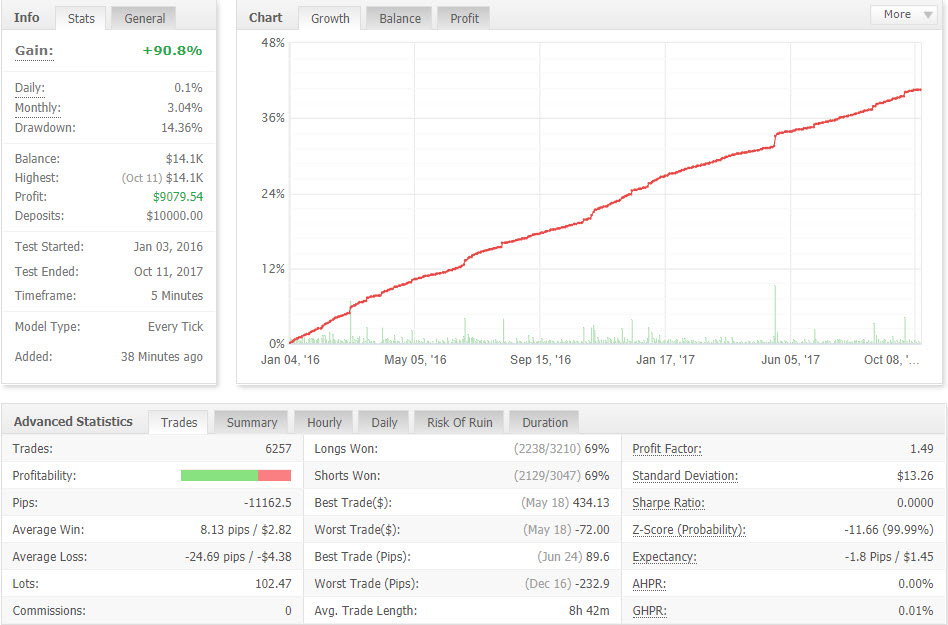
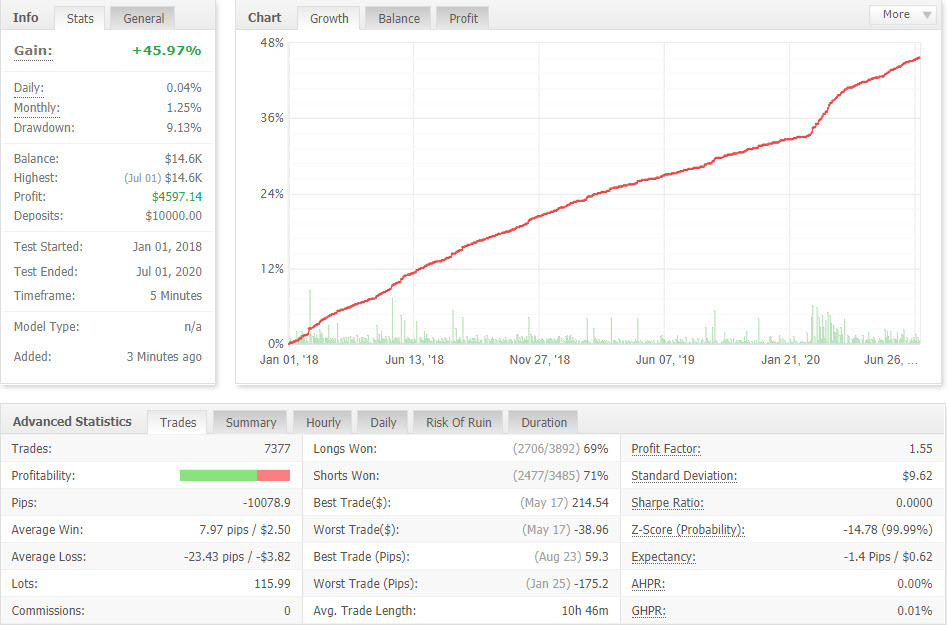
The strategy report offered a sneak peak into the longevity behind the 5 minute strategy. As you can see in the image below, the equity curve is in a nice uptrend without any major volatility.

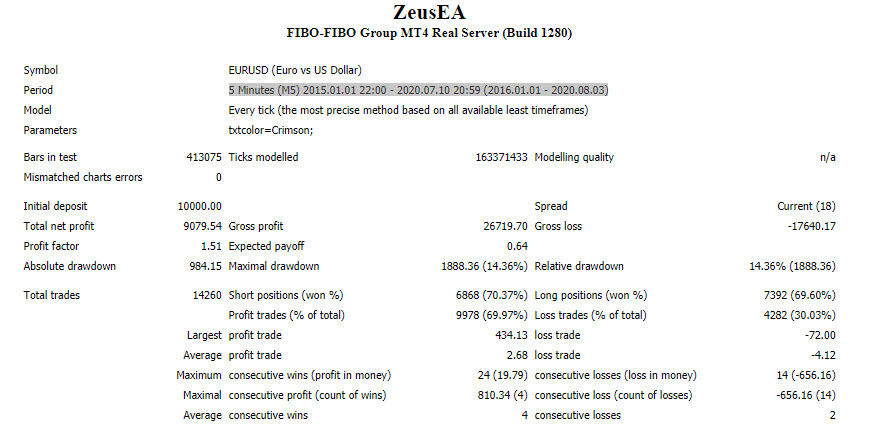
The following stats show the robustness of the strategy:
- Win rate: 70%
- Max consecutive losses: only 2x
- Profit factor: 1.51
The Zeus EA Myfxbook adds more interesting information that the above strategy report lack:
- Average trade length: 8 hours and 42 minutes
- Risk of ruin is extremely small
- Very stable equity curve, so most traders will not get scared when trading it
The statistics become even more impressive when you take into account that there were more then 14,000 trades in total. That is more than 3,000 trades per year and 250 per month. Simply said, there is enough data to support the strategy.
Another aspect to consider is sheer length of the completed back-testing for a 5 minute chart. There are 1,440 candles per week on the 5 minute chart, which is about 73,000 candles per year. The total number of candles used for this back-test is a whopping +/- 336,000 candles. Impressive.
In fact, the test is so long that the data does not fit on the myfxbook. The total result shows +90.8% because the testing was completed with 10,000 capital. But the graph can only show the results up to October of 2018. This is why we uploaded another test, which shows the Zeus EA results from 2018 to 2020.
As you can see, the curve for the 2018-2020 test stays more or less the same as the 2016-2018 part of the 2016-2020 test.
Which Style for Zeus EA is Better?
This depends on your risk appetite. Let’s discuss draw-down first of all.
Draw-Down
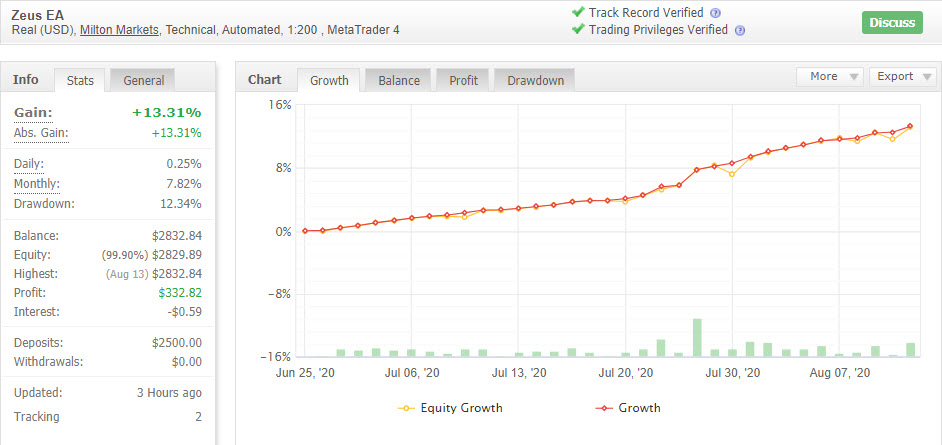
It is important to note that the draw-down is the historical maximum draw-down based on 4 years and 7 months of back-testing. It does not mean that this draw-down is common or occurs regularly. Actually, the draw-down is usually speaking way lower. The ECS live account is a good example of that. It only has a 12.3% draw-down (as of 14.08.2020).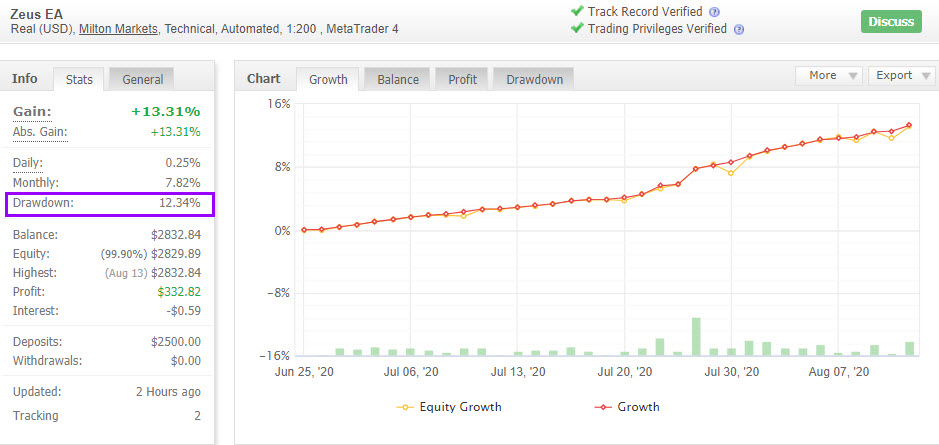
Optimizing Gain
If you want to optimize your gain percentage, then using the lowest capital possible makes sense. Why? Because the remainder of the capital can trade the Zeus EA with multiple licenses or other EAs.
For instance, if you have 5,000 in trading capital that you can risk and afford to lose, there are two ways of trading the Zeus EA:
- Trade all 5,000 with one micro on one account: 1x 5,000.
A trader could expect on average and in the long run a return of 3.3% per month with 28.8% DD. Requires one license. - Trade 5,000 with one micro on two accounts: 2x 2,500.
This means that a trader is trading 2x 2,500. A trader could expect on average and in the long run a return of 6.6% per month with 57.8% DD. Keep in mind that you need to buy 2 licenses for this option.
If you are more risk averse and want to avoid any chance of a larger draw-down taking place, then trading with 3,000-4,000 per license should be sufficient for most traders.
If you want to fully maximize the potential gain, then buying two licenses and trading each account with 2,500 is the best approach. This allows a trader to reach the most profits.
How Was the Back-Testing Completed?
The testing was completed with 99.9% modelling accuracy. The price feed is from Dukascopy quotes.
There have been two back-testing periods completed:
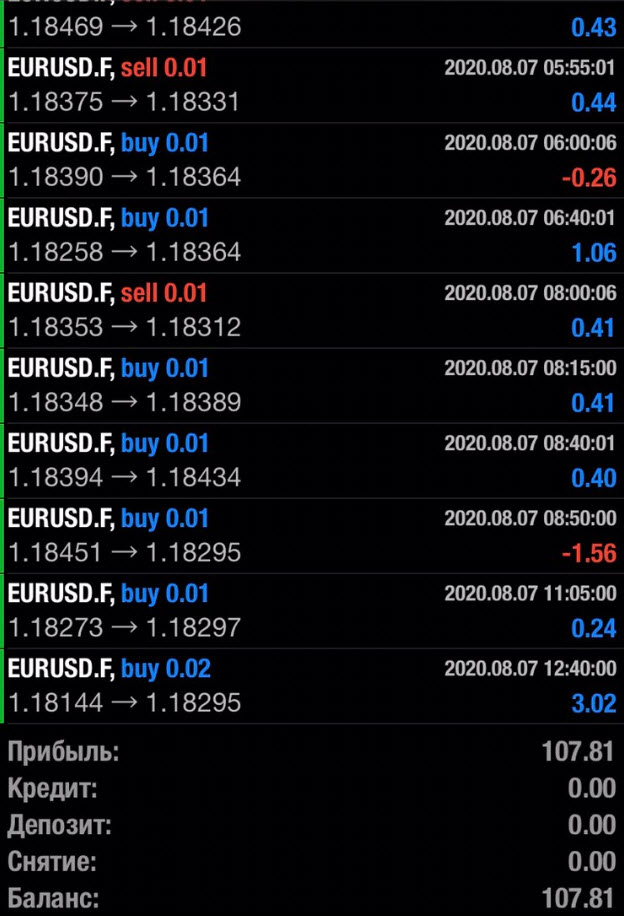
You might be wondering if there is any live trading as well? Yes there is.
Here are also a few examples of live trades:
How Can I Join Zeus EA?
You can either rent the EA or join at no upfront fees or costs via the profit share module.
Rental options:
Explorer – €89 per month
- VPS? – 1 month
- Preferred Equity Size: €2,500
- Expected Monthly ROI: €150 – €200
- MT4 Credentials Sharing: required
- Sum of Supported EA Accounts: 1
Builder – €299 per year
- VPS? – 12 months
- Preferred Equity Size: €2,500
- Expected Annual ROI: €1,500 – €2,500
- MT4 Credentials Sharing: required
- Sum of Supported EA Accounts: 1
Conqueror – €699 per year
- VPS? – 14 months
- Preferred Equity Size: €7,500 (3×2,500)
- Expected Annual ROI: €4,500 – €7,500/account
- MT4 Credentials Sharing: required
- Sum of Supported EA Accounts: 3+
Zeus EA profit share module
- No upfront fees or costs
- Pay only when your account makes a profit using high water mark module (account must make a new high)
- Calculated per month
- Profit share percentage of profit that goes to Elite CurrenSea:
- €15,000 or lower → 30%
- €15,000-€20,000 → 25%
- €20,000-€100,000 → 20%
- €100,000 + → custom
Join Zeus EA now and capture up to 6.6% per month
Good Trading,
Team of Elite CurrenSea


Leave a Reply