❗️ USD/JPY Bullish but Channel Top Should Create Bull Flag Soon ❗️
March 4, 2021
3 min read

Dear traders,
the USD/JPY has reached the top of the bullish trend channel again. The JPY weakness trend, however, is strong.
Price action could break above the channel this time around. Let’s review.
Price Charts and Technical Analysis
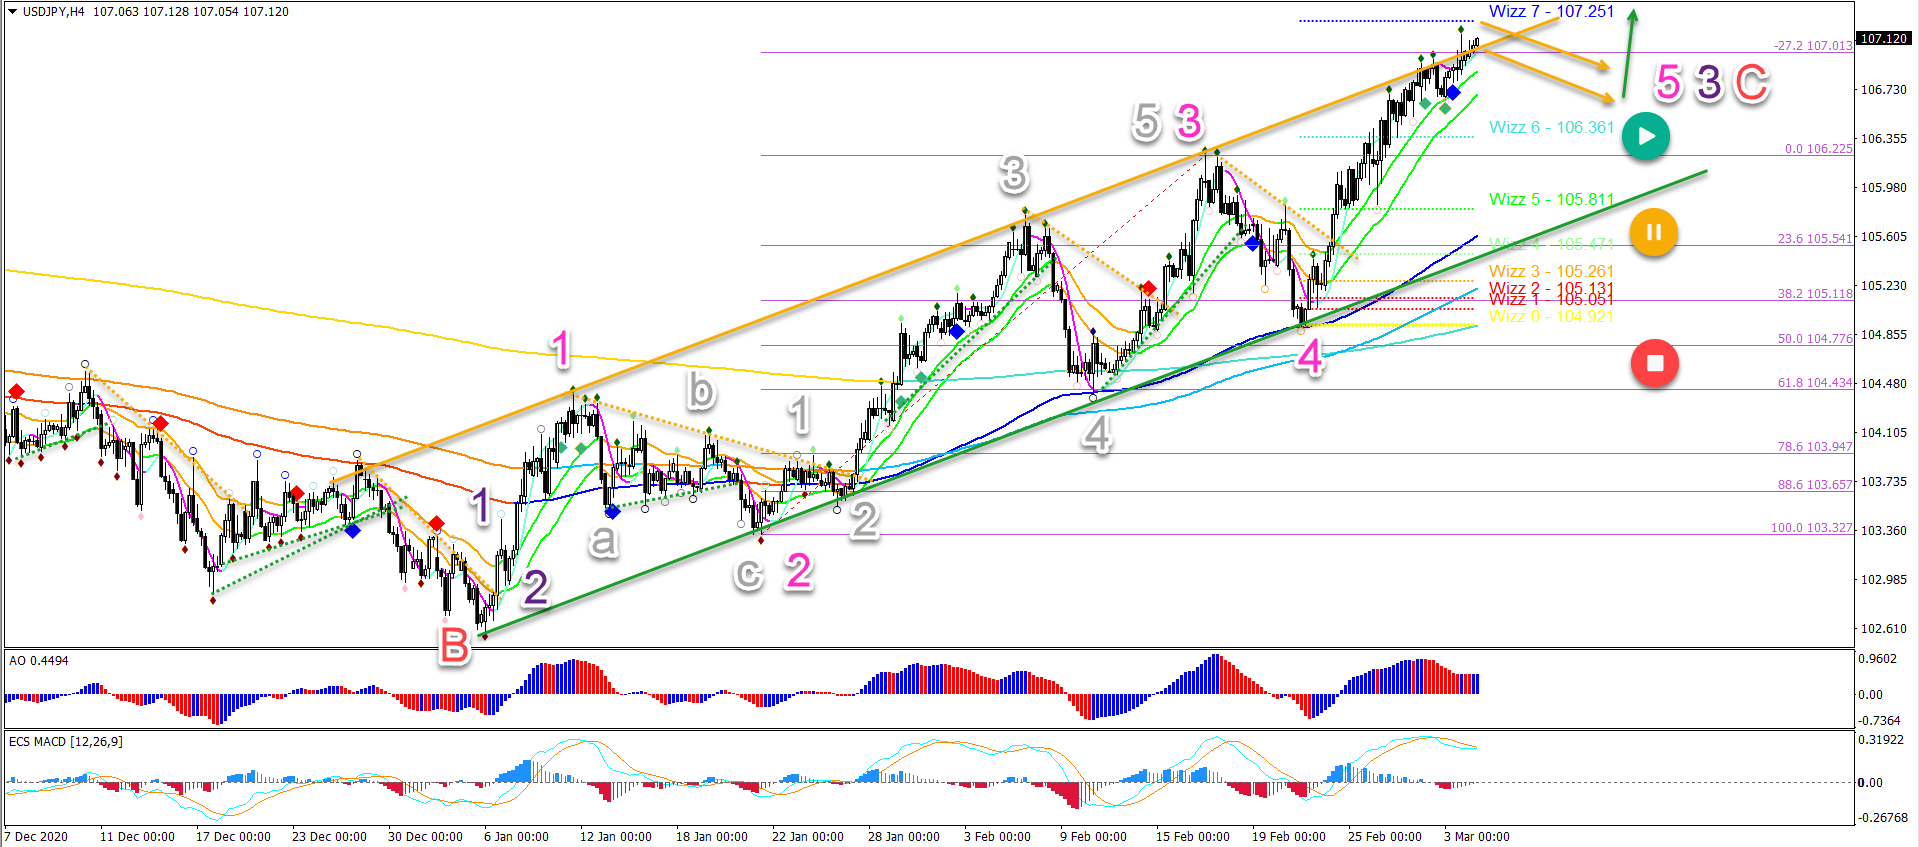
The USD/JPY is showing multiple higher highs and higher lows. The bullish price swings are impulsive whereas the bearish ones are mostly corrective. What does this mean?
- It confirms a bullish 5 wave pattern (purple) in a larger wave C.
- The wave 5 (pink) is now testing the channel resistance and Wizz 7 target.
- This zone could create a bearish correction such as a bear flag (orange arrows).
- An immediate push higher could reach the round level at 107.50-107.75.
- An uptrend continuation is expected (green arrow) towards Wizz 8 at 108.70 after the bull flag.
- The uptrend remains valid as long as price action remains within the bullish channel.
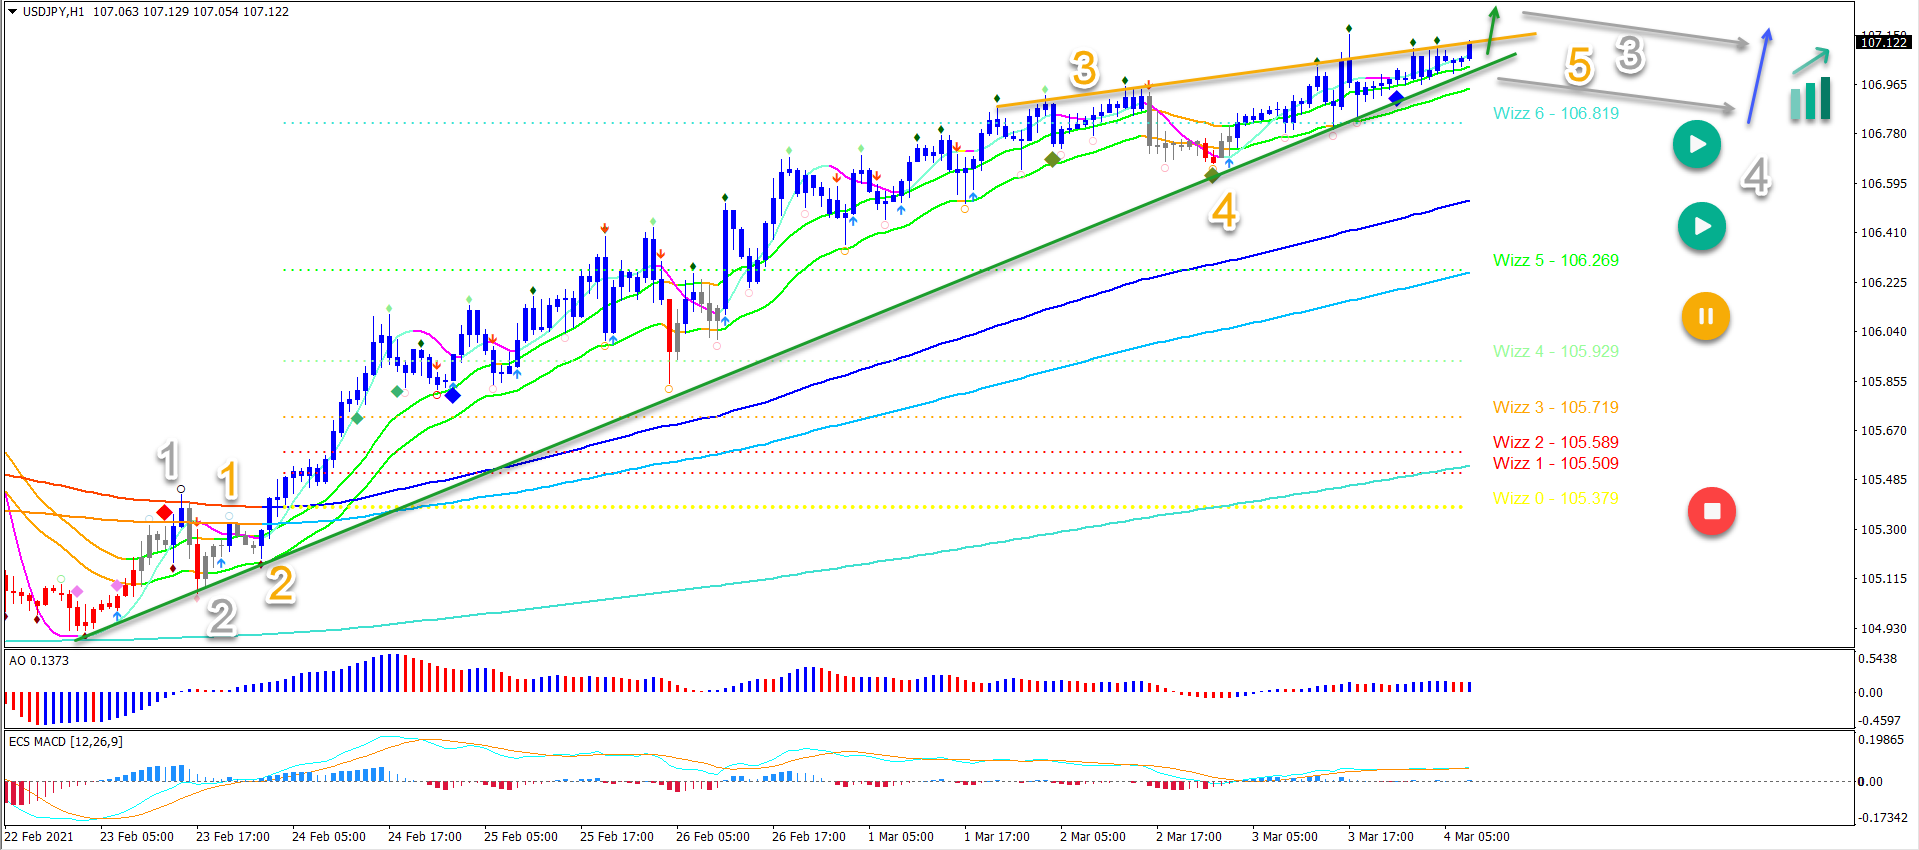
On the 1 hour chart, price action is looking for an immediate bullish breakout (green arrow). The immediate target is aiming at the 107.50-107.75 zone.
- Eventually a bull flag pattern (grey arrows) is expected.
- This could complete wave 4 (grey).
- The bullish breakout (blue arrow) should continue higher after wave 4 is completed.
- The long-term 144-233 ema moving averages should act as support if price action retraces that deep.
- Only a break below those EMAs places the uptrend in danger.
The analysis has been done with the indicators and template from the SWAT method (simple wave analysis and trading). For more daily technical and wave analysis and updates, sign-up to our newsletter.
Good trading,
Chris Svorcik


Leave a Reply