🚀 DJI30: Max Mild Pullback as Uptrend Aims at 35k & 40k 🚀

Dear traders,
the Dow Jones Index (DJI 30) has broken the previous top with confidence. The bulls are now pushing away from the 21 ema zone without looking back.
Today’s article will analyse whether this uptrend train can continue. We review the critical support and resistance levels for breakouts and pullback bounces.
Price Charts and Technical Analysis
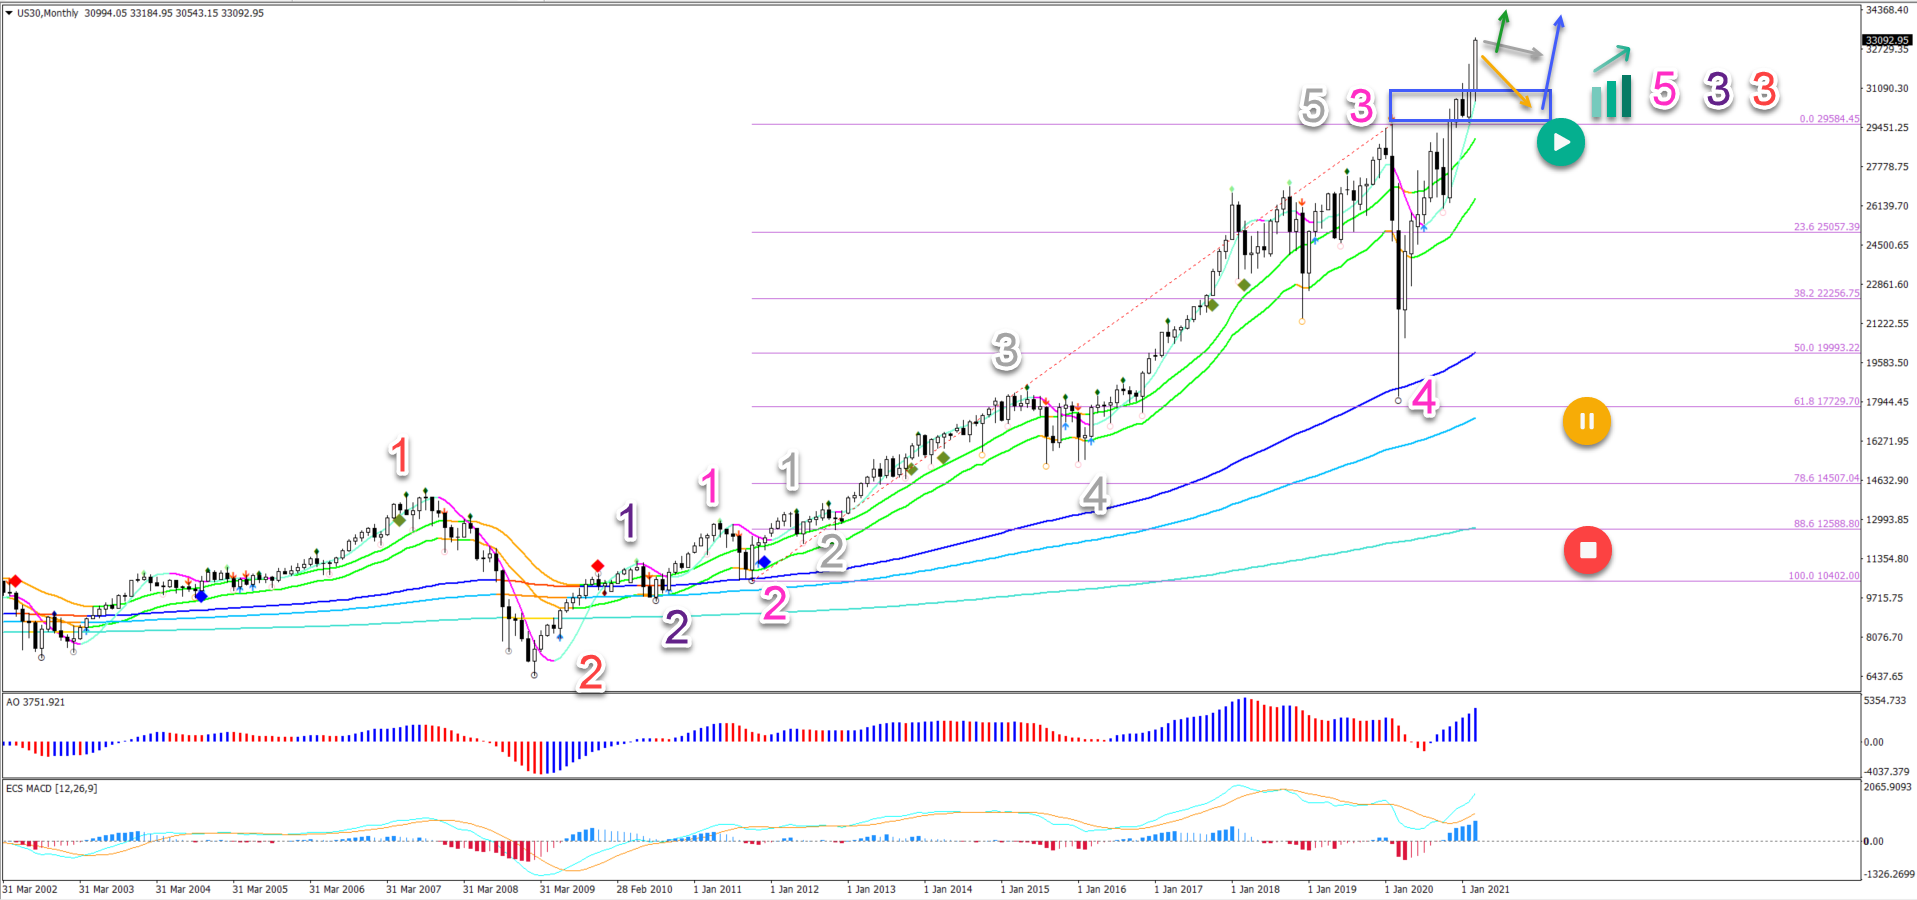
The US 30 index (DJI) seems to be moving higher as part of a super large wave 3 (purple) of wave 3 (red). The wave 3 of wave 3 could be strong, impulsive, and move up far.
With the wave 4 (pink) pullback recently completed (March 2020), the bulls are in control of the chart as long as price action remains above the 21 ema low.
- A pullback (orange arrow) to the 21 ema zone and previous top is a support zone (blue box) for a potential bounce (blue arrow).
- An immediate continuation (green arrow) is also possible. The main immediate targets are located at 33,500, 34,500 and 35,000.
- In the long run, price action could make it up as high as 40,000 or even 42,500 before completing one of the waves 3 (purple).
- The 21 ema zone remains a strong support area but even a small break below it would not change the bullish outlook. Only a deeper retracement could do that (yellow/red circles).
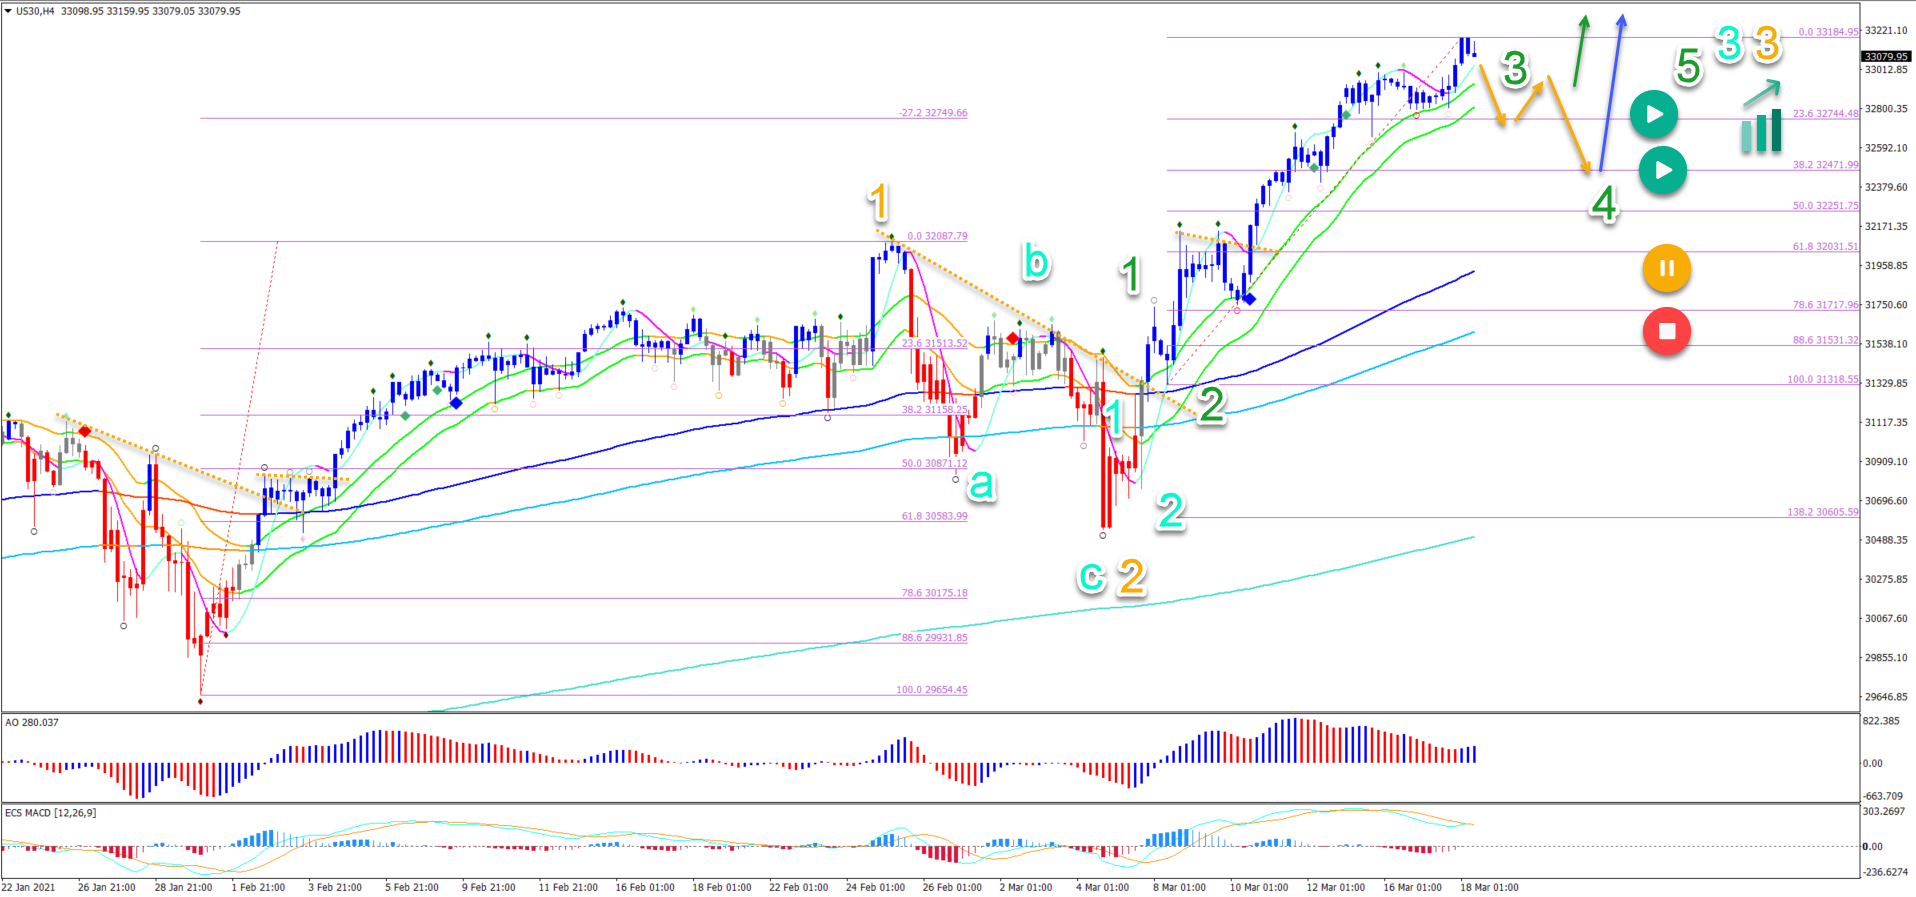
On the 4 hour chart, price action is showing another strong move up. Although price action needs to move up much higher to confirm a wave 3 (orange) pattern.
- Price action needs to reach at least 34,500 without any major pullback to confirm the wave 3 (orange).
- Only light pullbacks are expected in the wave 3 pattern.
- The 23.6% and 38.2% Fibonacci levels could act as support if this wave pattern is correct.
- A bullish bounce at the 23.6% (green arrow) or 38.2% Fib (blue arrow) is expected and could confirm the uptrend continuation.
- A retracement below the 61.8% Fib places this wave outlook on hold (yellow) and invalidates it (red) below the 78.6% Fib, although the overall uptrend could still be valid.
The analysis has been done with the indicators and template from the SWAT method (simple wave analysis and trading). For more daily technical and wave analysis and updates, sign-up to our newsletter.
Good trading,
Chris Svorcik


Leave a Reply