Rush.EA: Automated Intra-day Trading System Offers Strong & Consistent Account Growth


Dear Traders,
are you looking for an automated trading method with a more equally divided monthly income distribution?
The newest Rush EA could be a viable solution for you. It manages to book substantial gains in most of its months. Mislav Nikolic is again the creator behind this EA, but this time he focused on a 5 minute strategy with a smoother performance division than his first Ultima EA.
This article explains the Rush EA from Mislav, the back-testing results, the live trading performance, and how you can trade the EA yourself.
Ps. feel free to join the live webinar as well on Tuesday 5pm GMT 6 October 2020.
Rush EA: Intra-day Trading on EUR/USD 5min Chart
Mislav Nikolic is back as the creator of the Rush EA, just like the Ultima EA. Both EAs share some similarities but also differ in important ways.
Both Rush and Ultima EAs are primarily traded on the EUR/USD. Here are the results with the different possible risk levels:
| Back-test 1.5 yrs | Rush EA 5% risk | Rush EA 3% risk | Rush EA 1% risk |
| Risk style | High risk | Medium risk | Low risk |
| Average gain per month | 33% | 20% | 7% |
| Max historical draw-down | 76% | 55% | 21% |
| Available | Both profit share with €1,000 min and rental |
Both profit share with €5,000 min and rental |
Only rental |
But the Rush EA is considered to be a scalping and intra-day strategy on the 5 minute chart. The Ultima EA is mainly meant for intra-week and swing trading on the 15 min chart or even 60 min chart.
For instance, the Rush EA has twice as many trades with half the average trade length when compared to Ultima EA.
Another key difference is that Rush EA is more consistent on a monthly basis:
- Rush EA is able to close a month in positive territory in about 89% of the cases versus 83% (6% less) for Ultima EA.
- Rush EA achieves more than 10% profit per month in 78% of the cases versus 60% (18% less) of the cases for Ultima EA.
- Rush EA has a win rate with 75%, which is 10% higher than Ultima EA.
- Rush EA also manages to earn more per month, but the potential DD is also higher.
Let us compare Rush EA 5% risk with Ultima EA 5% risk:
| Category | Rush EA 5% risk | Ultima EA 5% risk | Compare |
| Currency pair | EUR/USD | EUR/USD | same |
| Time frame | 5 min | 15 + 60 min | x |
| System type | Trend | Trend | same |
| Targeting | Tight (closer) | Loose (further) | x |
| Win rate | 75% | 65% | Rush EA +10% |
| 10% profits + per month | 78% | 60% | Rush EA +18% |
| Winning months | 89% | 83% | Rush EA +6% |
| Average gain per month | 30% | 25-28% | Rush EA +3% |
| Max historical draw-down | 77% | 55% | Ultima EA 22% |
Both EAs do share some similarities. They both are trending systems, looking for pullback and continuation. Both also use the Bullseye target indicator for their exiting. But important and key differences have been added. Rush EA uses a more conservative exiting style (hitting targets sooner) that would suit the mentality of many traders who are looking for quicker ins and outs.
Let us compare Rush EA 3% risk with Ultima EA 3% risk:
| Category | Rush EA 3% risk | Ultima EA 3% risk | Compare |
| 10%+ profits per month | 71% | 55% | Rush EA +16% |
| Winning months | 81% | 81% | Same |
| Average gain per month | 20% | 17% | Rush EA +3% |
| Max historical draw-down | 55% | 37% | Ultima EA 18% |
Should I Trade Rush EA or Ultima EA?
So which should you trade? The good news is that you can trade both (it’s not one or the other), if enough trading capital is available that you can afford to risk.
In fact, there are important benefits of trading both Ultima and Rush. Dividing capital on both EAs is a useful way to reduce your risk and exposure to one trading system.
| System | Rush EA | Ultima EA |
| Conclusion | Gains are higher and more consistent but riskier trading with higher draw-down | Lower expected draw-down but returns are slower and more spread over year |
| Category | High risk | High risk |
| Our goals | Trade with profits | Build account |
| Steps |
|
|
| Consistent results | Yes | Large waiting periods |
| Average number of trades | 2 per day | 1 per day |
The minimum capital for trading the Rush EA is currently €1,000. This will increase by the end of 2020.
Ultimately, the Rush EA gains are usually more equally distributed than Ultima EA. So traders can withdraw the profits quicker and trade with their profits instead.
Trading both though as its advantages as well.
What Are the Results With Back-Testing?
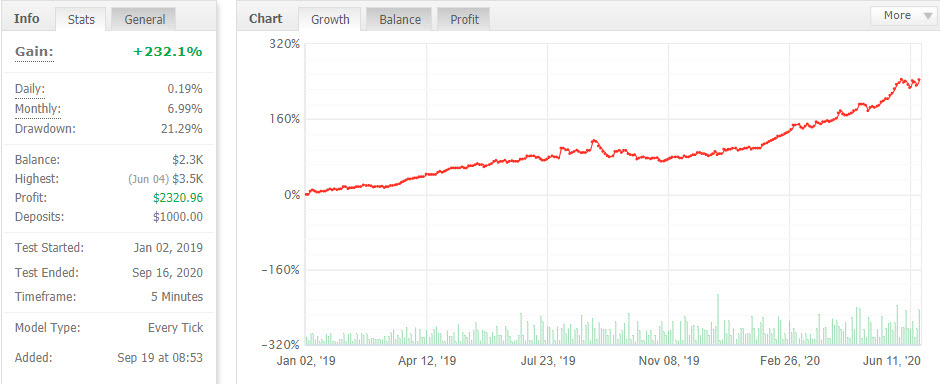
The Rush EA has been back-tested on the EUR/USD 5 min chart using both 3% risk and 5% risk per setup. The total length of the testing was 1.5 years from January 2019 to June 2020. This is a very lengthy test for a low time frame. In fact, the total testing was done on more than +/- 110,000 candles.
The back-testing was completed with the highest MT4 standards possible, including 99.9% modelling accuracy using Dukascopy and Tick Data Suite and updates with every tick. The back-testing results have been uploaded to our myfxbook account where all statistics can be reviewed.
Results 5% risk per setup
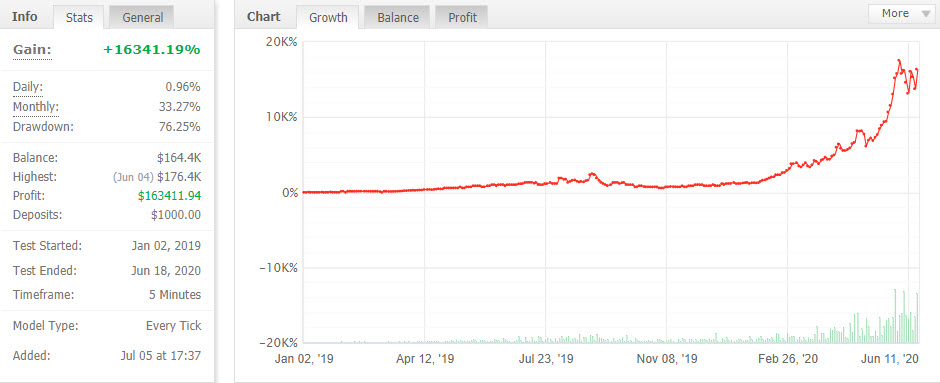
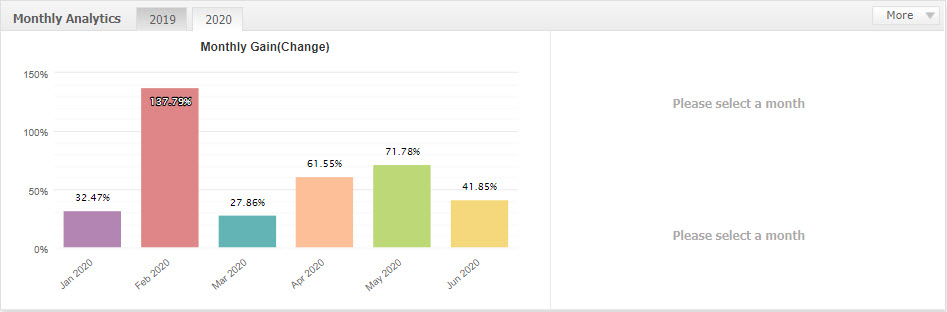
The most interesting statistic is the average gain per month. The Rush EA managed to gain an average of 30% per month, which offers your account the potential for quite a substantial growth path.
What does that mean if you started with a simple $1,000 account in January 2019? The Rush EA managed to turn a $1,000 account into a total of $163,000+ in just 1.5 years.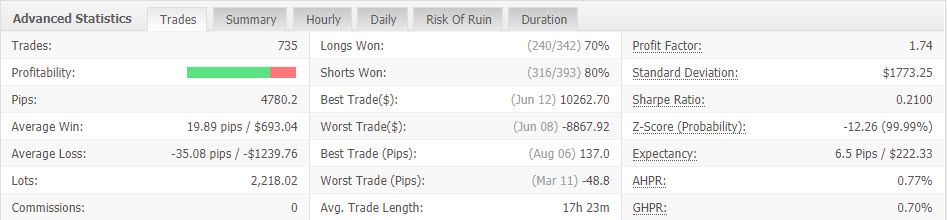
Both 2019 and 2020 mostly ended up with winning months.There were 16 winning and profitable months out of a total of 18 months. 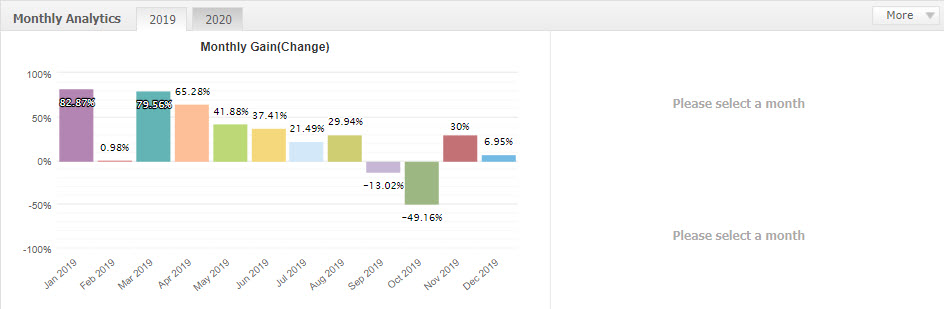
Results 3% risk per setup

Results 1% risk per setup
Logically, the expected gains are smaller but the maximum historical draw-down too. Here is a simple overview once again – as mentioned at the very beginning of our article as well.
| Back-test 1.5 yrs | Rush EA 5% risk | Rush EA 3% risk | Rush EA 1% risk |
| Risk style | High risk | Medium risk | Low risk |
| Average gain per month | 33% | 20% | 7% |
| Max historical draw-down | 76% | 55% | 21% |
| Available | Both profit share with €1,000 min and rental |
Both profit share with €5,000 min and rental |
Only rental |
Are You Trading the System EA on a Live Account?
Yes, both Elite CurrenSea and Mislav Nikolic have their own live trading accounts.
Here are the links:
Our account started trading at the end of July. The gain has been slower than expected but that is because of the draw-down that occurred in August. Check the links for the most recent results.
How Can I Join Rush EA
The Rush EA is available both via rental and profit share module.
- The rental version is available for 1, 3 and 6 months.
- The profit share module can be traded either via 3% risk or 5% risk per setup. The minimum capital for 5% risk is €1,000 and for 3% risk is €5,000.
| Product | Pricing |
| Profit share 5% risk per setup with €1,000 – €10,000 | 30% profit share (no upfront costs) |
| Profit share 5% risk per setup with €10,000+ | 25% profit share (no upfront costs) |
| Profit share 3% risk per setup with €5,000+ | 30% profit share (no upfront costs) |
| Rental 1 month | €249 per month |
| Rental 3 months | €549 total (€183 average / month) |
| Rental 6 months | €899 total (€150 average / month) |
| Rental with capital above €10,000 | Custom |
The profit share module works with a high-water-mark method. This means that profit is only shared if profits are made on a monthly basis. Traders need to share 25-30% of their profits with us and they keep the remaining 70-75% of the profits.
What is better for you, rental or profit share?
When comparing 30% profit share with 3 or 6 months rental using 5% risk:
- Profit share is the best option for traders using €2,000 euro or less.
- Rental becomes cheaper for traders who trade with more than €2,000.
When comparing 30% profit share with 6 month rental using 3% risk:
- Rental is always cheaper than profit share
- But profit share has no upfront costs
Here is a full overview of other details:
| Product | VPS | Returns | Account sharing |
| Profit share 5% risk per setup with €1,000 – €10,000 | Not needed | 30% per month / max DD 77% | Not needed |
| Profit share 5% risk per setup with €10,000+ | Not needed | 30% per month / max DD 77% | Not needed |
| Profit share 3% risk per setup with €5,000+ | Not needed | 30% per month / max DD 77% | Not needed |
| Rental 1 month | Not included / VPS from Mislav Nikolic costs €68 per month + €47 1 time fee | You can choose your own risk settings | Not for EA but yes for VPS from Mislav Nikolic |
| Rental 3 months | Not included / VPS from Mislav Nikolic costs €68 per month + €47 1 time fee | You can choose your own risk settings | Not for EA but yes for VPS from Mislav Nikolic |
| Rental 6 months | Not included / VPS from Mislav Nikolic costs €68 per month + €47 1 time fee | You can choose your own risk settings | Not for EA but yes for VPS from Mislav Nikolic |
Here is how you can sign-up for Rush EA Profit share module and EA rental. 
Or you can get more information via our live webinar on Tuesday 5pm 6 October 2020.
Sign-up and watch the live webinar
Wish you good trading!
Chris Svorcik – Elite CurrenSea
Mislav Nikolic – Rush EA and Ultima EA creator


Leave a Reply