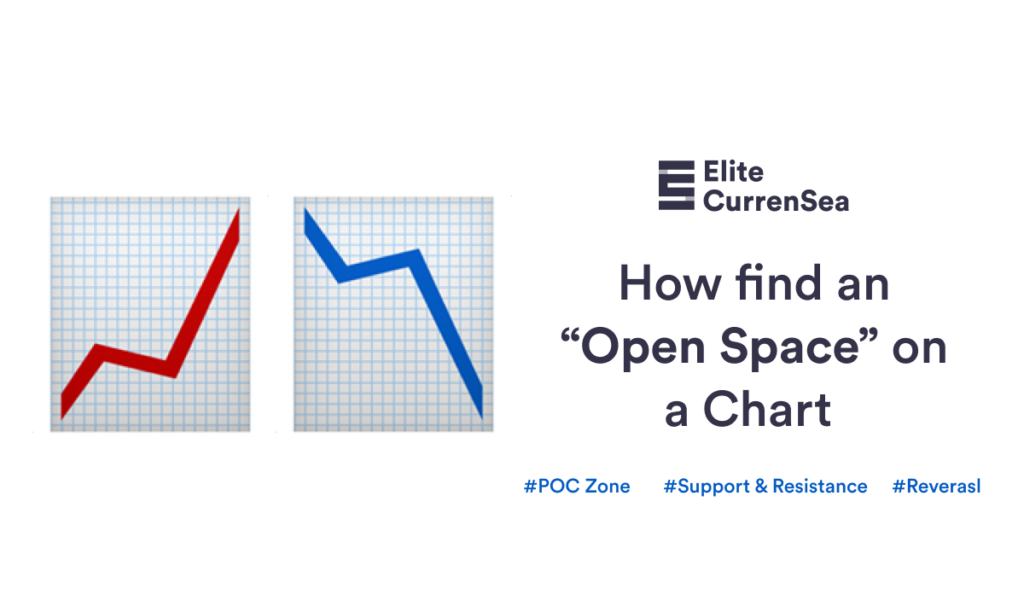
Open Chart Spaces Indicate Where to Find Better Entries

Dear Traders,
Do you sometimes enter a trade setup but then see price do an immediate reversal after slamming into a new layer of support or resistance?
Traders who use the “open space” chart concept will be better off because they will be able to find trades with more space to develop and less obstacles.
This article explains where and when price action can capitalize on the lack of key levels and move quickly impulsive into one direction.
Open Spaces Explained
You might be wondering what is “open space” and how does it help traders analyse the charts:
- Step 1: identify confirmation and invalidation levels.
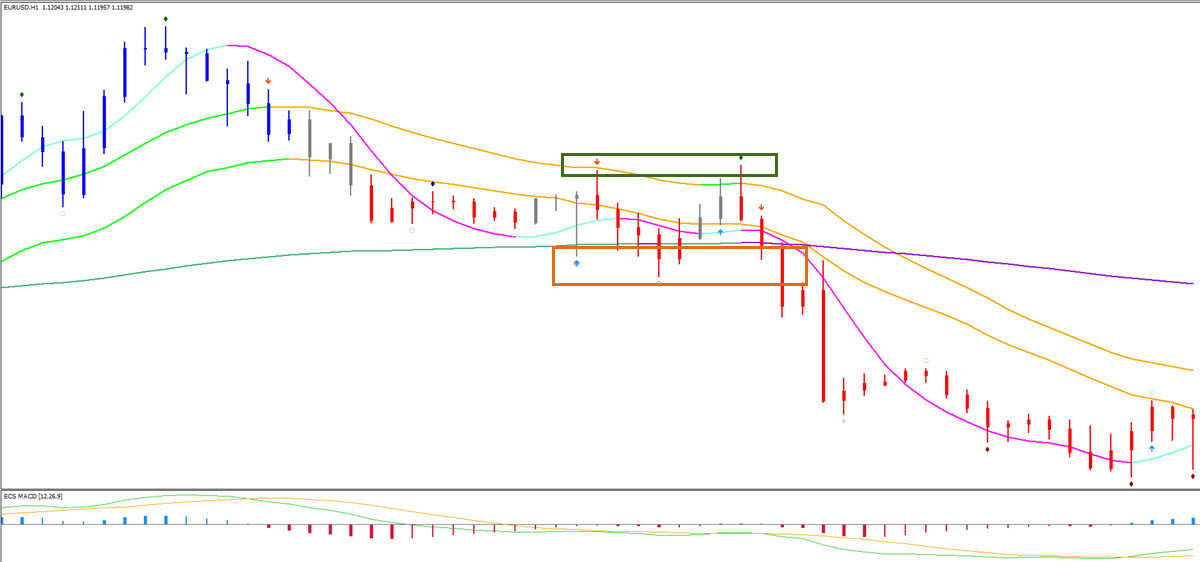
Find the point of confluence (POC) which we call “decision zone” and determine what are the key confirmation and invalidation levels for the POC zone.
In the chart below, the green box and orange box are the critical zones. The green box indicates confirmation level (fora bullish break) whereas the orange box is the invalidation spot (bullish break does not happen).
- Understand how far price can move when price bounces or breaks at the expected decision zone:
Where is the next decision zone?
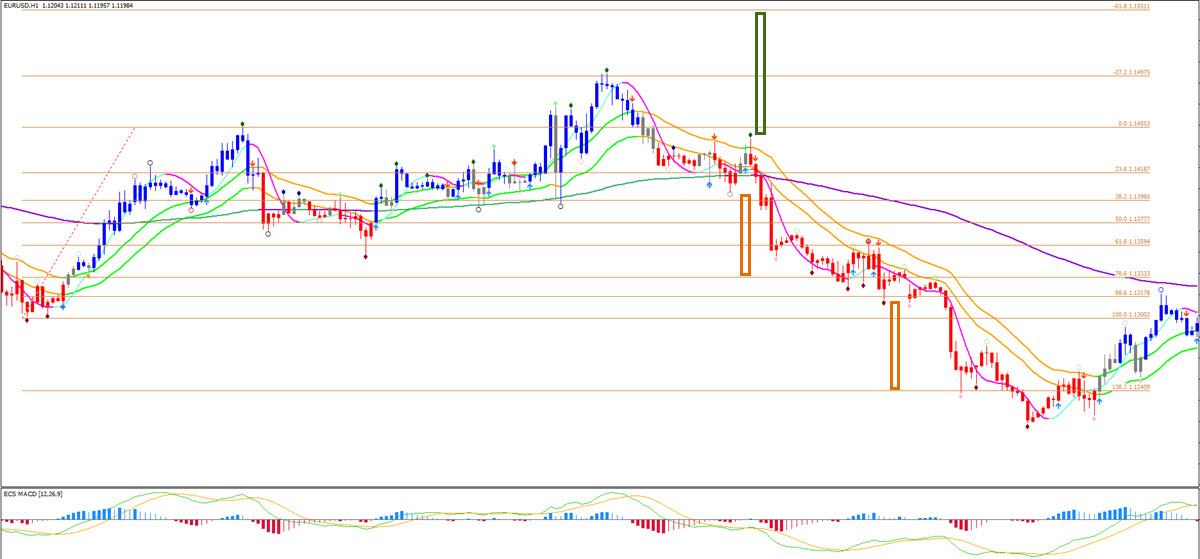
- Compare how big the zone is for the target with the zone where the invalidation level is.
- If the next expected decision zone is close by, then there is not much space for that trade and it could be better to skip the setup or enter with lower risk.

-
- Traders can compare this space zone (reward) to the risk zone (their stop loss size) and measure the reward to risk ratio.
- As a standard rule of thumb, traders want to have at least 1:1 reward to risk ratio when comparing the potential target zone with the risk zone.
- Traders can compare this space zone (reward) to the risk zone (their stop loss size) and measure the reward to risk ratio.

Trade With Wide Open Space
Open space is important because a trade which has small expected space could in fact not be worth trading whereas a trade with large expected space could be very interesting.
The best places on the chart for traders are “wide open spaces”. Areas of the chart where price has little standing in its way.. All of this is explained in our course called SWAT – simple wave analysis and trading.
Quickly explained: understanding the space is best done with Fibonacci, support and resistance, moving averages, and the Fibonacci sequence (ecs.WIZZ indicator).
- If price is moving into medium and/or long-term moving averages, then its movement will most often be naturally limited by those MAs.
- If price is moving away from the medium and long-term MAs, then this indicates a trend and the potential for a larger push. In that case, the potential space depends on the Fibonacci sequence zones, which are easily seen when using our ecs.WIZZ tool.
The ecs.WIZZ tool is a wonderful tool for spotting the wide open spaces. When price is able to pull away from the 144 ema (long-term MA) without retracing back to it, then the price is showing impulsive price action and the path of least resistance indicates that price is likely to keep moving away from the 144 ema. The space between the Fib sequence levels expand and become wider and wider as price moves further away from the 144 ema.
Catching a win that can move that far away from your entry can give an enormous boost to your trading account and really help the equity curve a lot. This is a key part of any trader’s motto, which is let your winners run and cut your losses short.
For more information, free analysis, webinars, videos, tools, systems, and methods for trading stocks, cryptos, Forex and options, please check out my website www.EliteCurrenSea.com.
Wish you good trading,
Chris Svorcik


Leave a Reply