? Gold Triangle Pattern Completing Final Wave E Pattern ?
Dear traders,
Gold (XAU/USD) is confirming a contracting triangle chart pattern. This price pattern was expected in our analysis after price action strongly dropped within a large and established uptrend. Is the triangle now close to being completed?
Price Charts and Technical Analysis
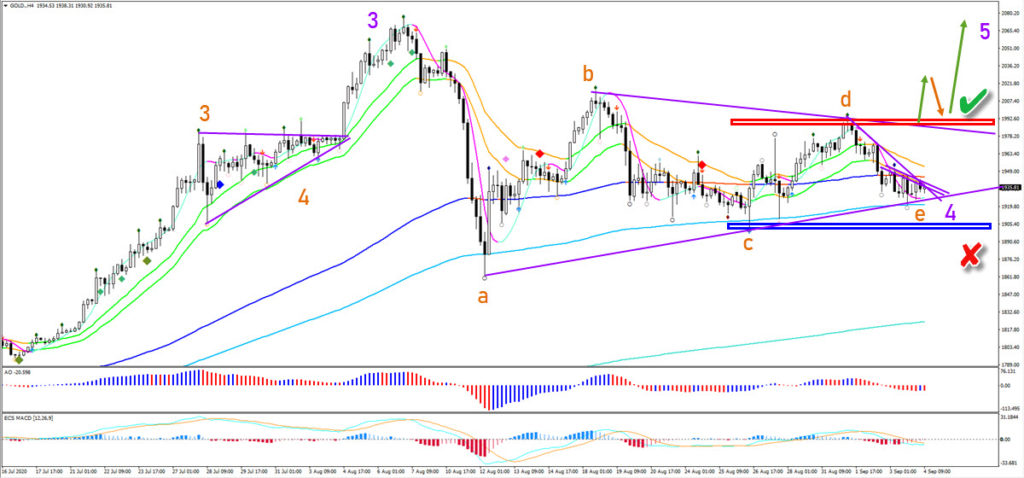
The XAU/USD is now testing the bottom of wave C (blue box). This is a critical and interesting point of any potential triangle pattern. The reason is simple: price is close to either confirming (green check) or invalidating (red x) this wave pattern. The retest of the previous bottoms could be a final wave E (orange) and indicate the end of the triangle pattern. This would also complete wave 4 (purple).
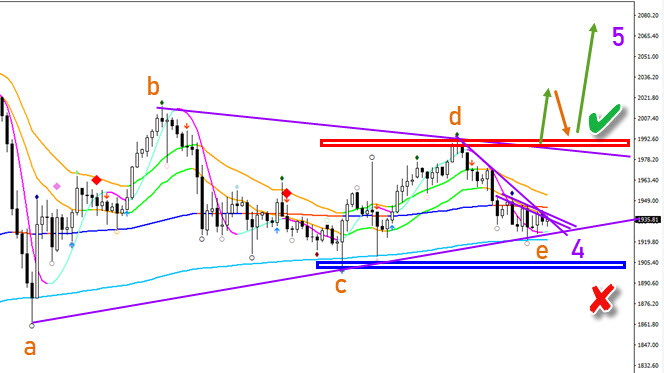
The breakout above the resistance trend line and the top of wave D (red box) would confirm the end of the triangle pattern and the continuation of the uptrend. The breakout is likely part of a wave 5. This wave 5 could be part of a wave 3 on higher time frames – especially when considering the strong uptrend. It is key that price action stays above the wave C bottom. A break above the 21 ema zone could already be a first clue that an upside break is around the corner.
The analysis has been done with the indicators and template from the SWAT method (simple wave analysis and trading). For more daily technical and wave analysis and updates, sign-up to our newsletter.
Good trading,
Chris Svorcik


Leave a Reply