🎯 Gold Bearish ABC Pattern Aiming at $1,700 Support 🎯

Dear traders,
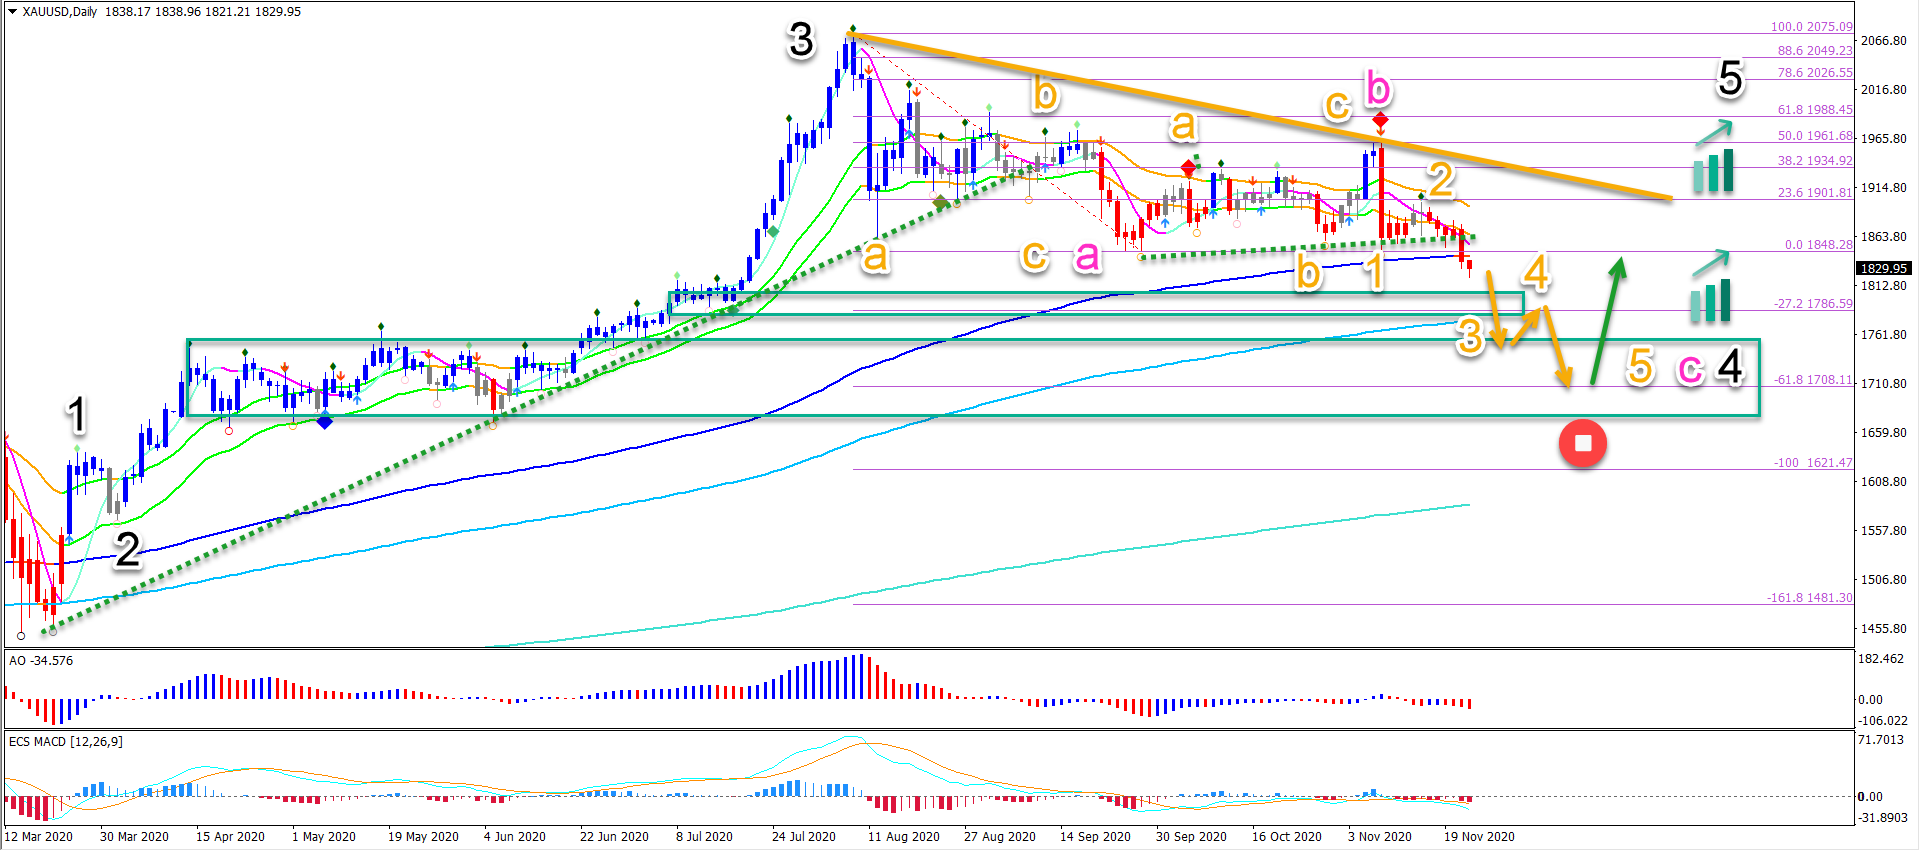
Gold (XAU/USD) is building a bull flag chart pattern (orange lines). Price action seems ready to break below the 21 ema zone. The main targets are the -27.2% and -61.8% Fibonacci targets.
Price Charts and Technical Analysis

The main target of XAU/USD with a bearish break below the 21 ema is the -61.8% Fibonacci. There is also a support zone and previous top (green box) which can stop price action from falling.
A break below the support zone, however, would invalidate the uptrend (red circle). In that case, a reversal is taking place that could take the price much deeper.
On the daily chart, price action seems to be developing an ABC (pink) pattern. A bearish swing via 5 waves (orange) could complete wave C (pink) and potential wave 4 (black).
As long as price respects the -27.2% and -61.8% Fibonacci targets, then an uptrend still remains likely. Only a break below $1700 changes the perspectives and makes a reversal more likely (red circle).
The analysis has been done with the indicators and template from the SWAT method (simple wave analysis and trading). For more daily technical and wave analysis and updates, sign-up to our newsletter.
Good trading,
Chris Svorcik


Leave a Reply