❗️ GBP/USD Reaches Critical Juncture at 1.39 Support Zone ❗️
April 22, 2021
4 min read

Dear traders,
the GBP/USD is breaking above the 21 ema zone on the daily chart. But price action is also facing a strong resistance zone.
Will the uptrend prevail or is a bearish reversal around the corner?
Price Charts and Technical Analysis
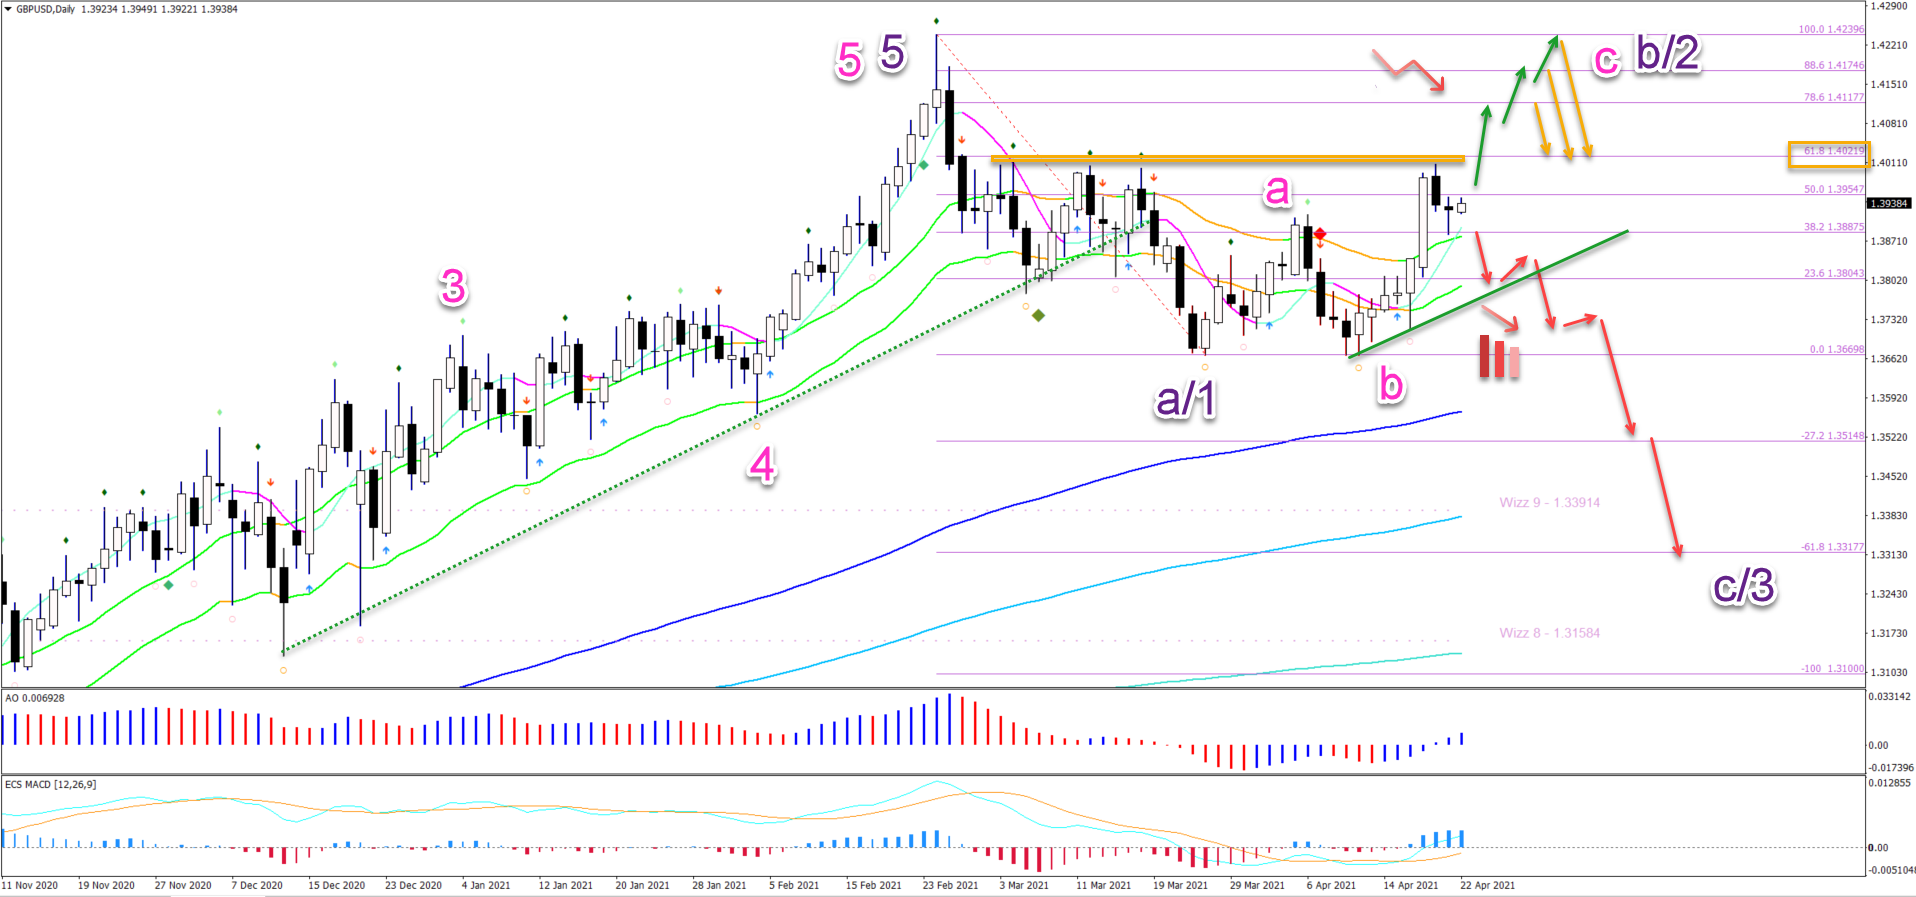
The GBP/USD seems to be running out of steam after the bearish breakout below the support trend line (dotted green). Let’s review all the angles:
- Divergence pattern is visible between wave 3 and 5 (purple). This is not visible on the daily chart above as we zoomed into the price chart.
- The target of the divergence pattern is usually at very least the 144 ema close (could be more). Price action has not retraced to this level yet and is therefore still expected to do so.
- The wave patterns suggest 5 waves down in a wave A or 1 (purple).
- The bullish pattern could easily be an ABC (pink) pattern in wave B or 2 (purple). But a bearish bounce is needed to confirm it tho (orange arrows):
- A bearish bounce at the 61.8% Fib could be part of a wave 2 or wave B zigzag
- A bearish bounce at the 78.6% Fib is probably a wave 2.
- A bearish bounce at the 88.6% Fib or higher is either a wave 2 or wave B flat.
- A bearish breakout below the 21 ema zone (red arrows) could confirm the push lower towards the 144 ema and the Fibonacci targets.
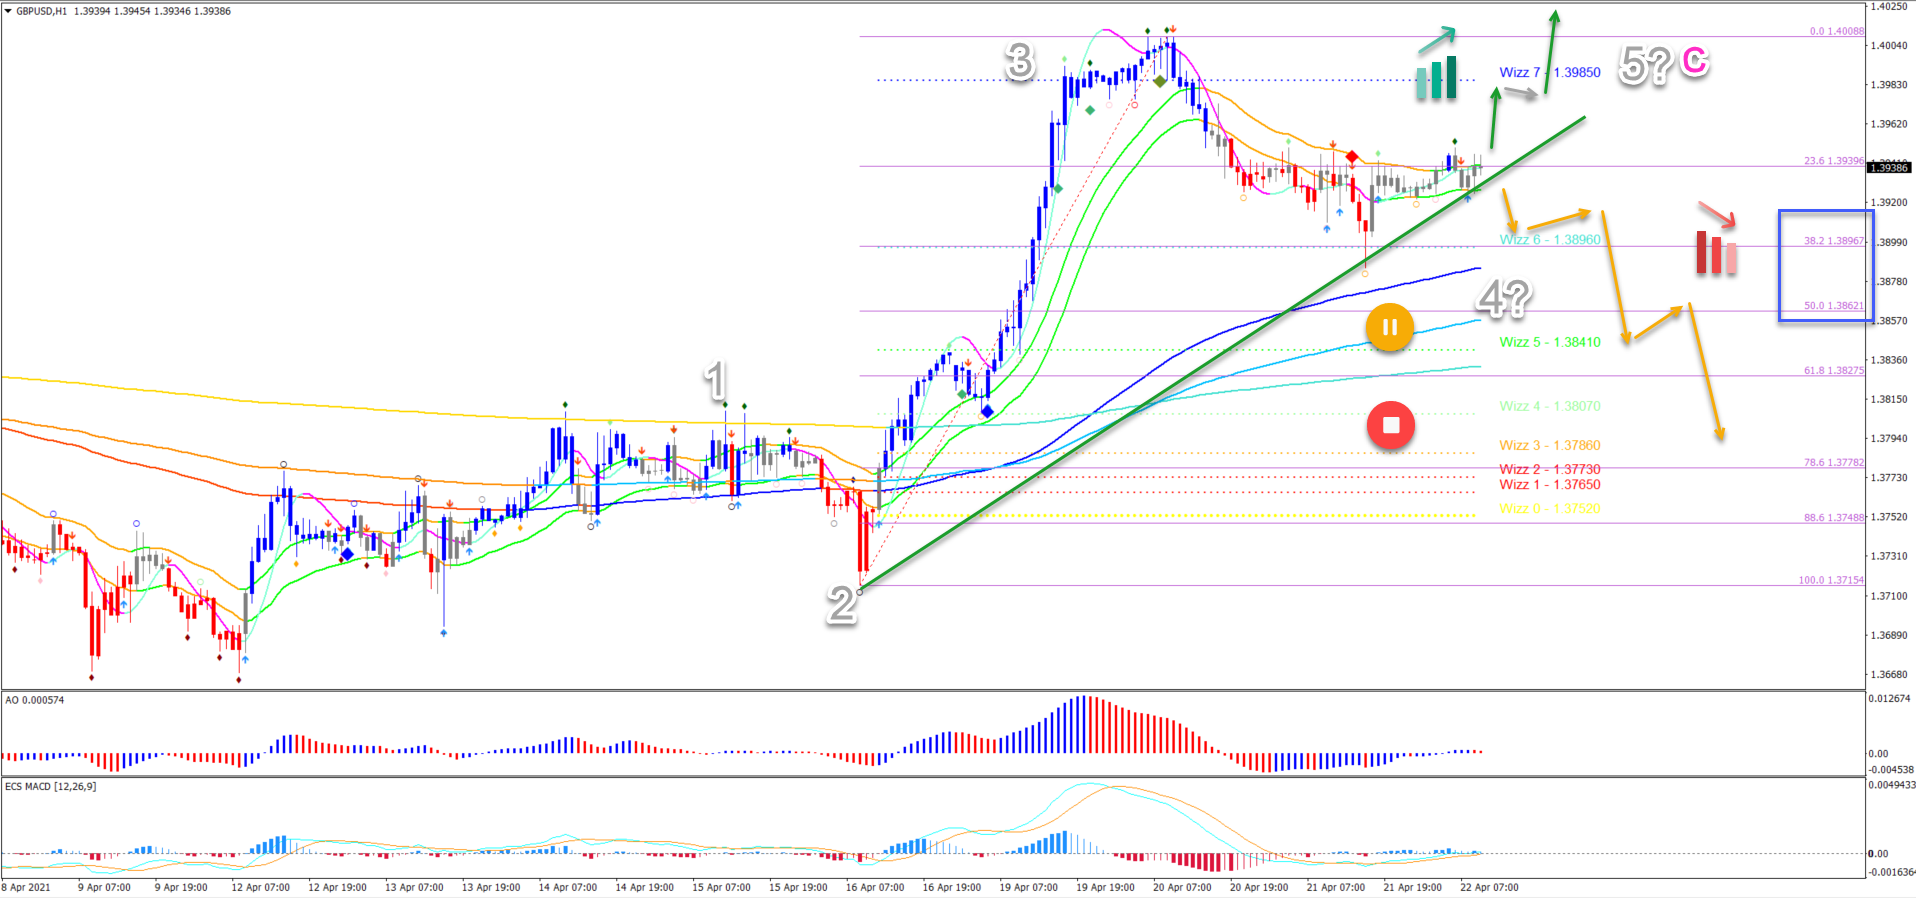
On the 1 hour chart, the important decision point becomes even more clear. Price action could still be in an ongoing wave C (pink) if price action respects the shallow Fibs:
- Price action showed strong momentum up, which could either complete wave C (pink) or be a part of wave 3 (grey).
- Price action bounced at the shallow 38.2% Fibonacci retracement level, which could mean a wave 4 (grey).
- A bullish breakout favours one more price swing up (green arrows). Although a bull flag pattern (grey arrow) would help confirm the upside.
- A bearish breakout, however, indicates probably the end of the wave 4 pattern and the start of a downtrend.
The analysis has been done with the indicators and template from the SWAT method (simple wave analysis and trading). For more daily technical and wave analysis and updates, sign-up to our newsletter.
Good trading,
Chris Svorcik


Leave a Reply