🚀 GBP/JPY Prepares for Break, Pullback and Bullish Continuation 🚀


Dear traders,
the GBP/JPY made a deep decline recently. But the rebound up is equally impressive.
The volatile price action makes it difficult to read the charts properly. But we could see this improve if a clear bearish ABC pattern soon appears.
Price Charts and Technical Analysis
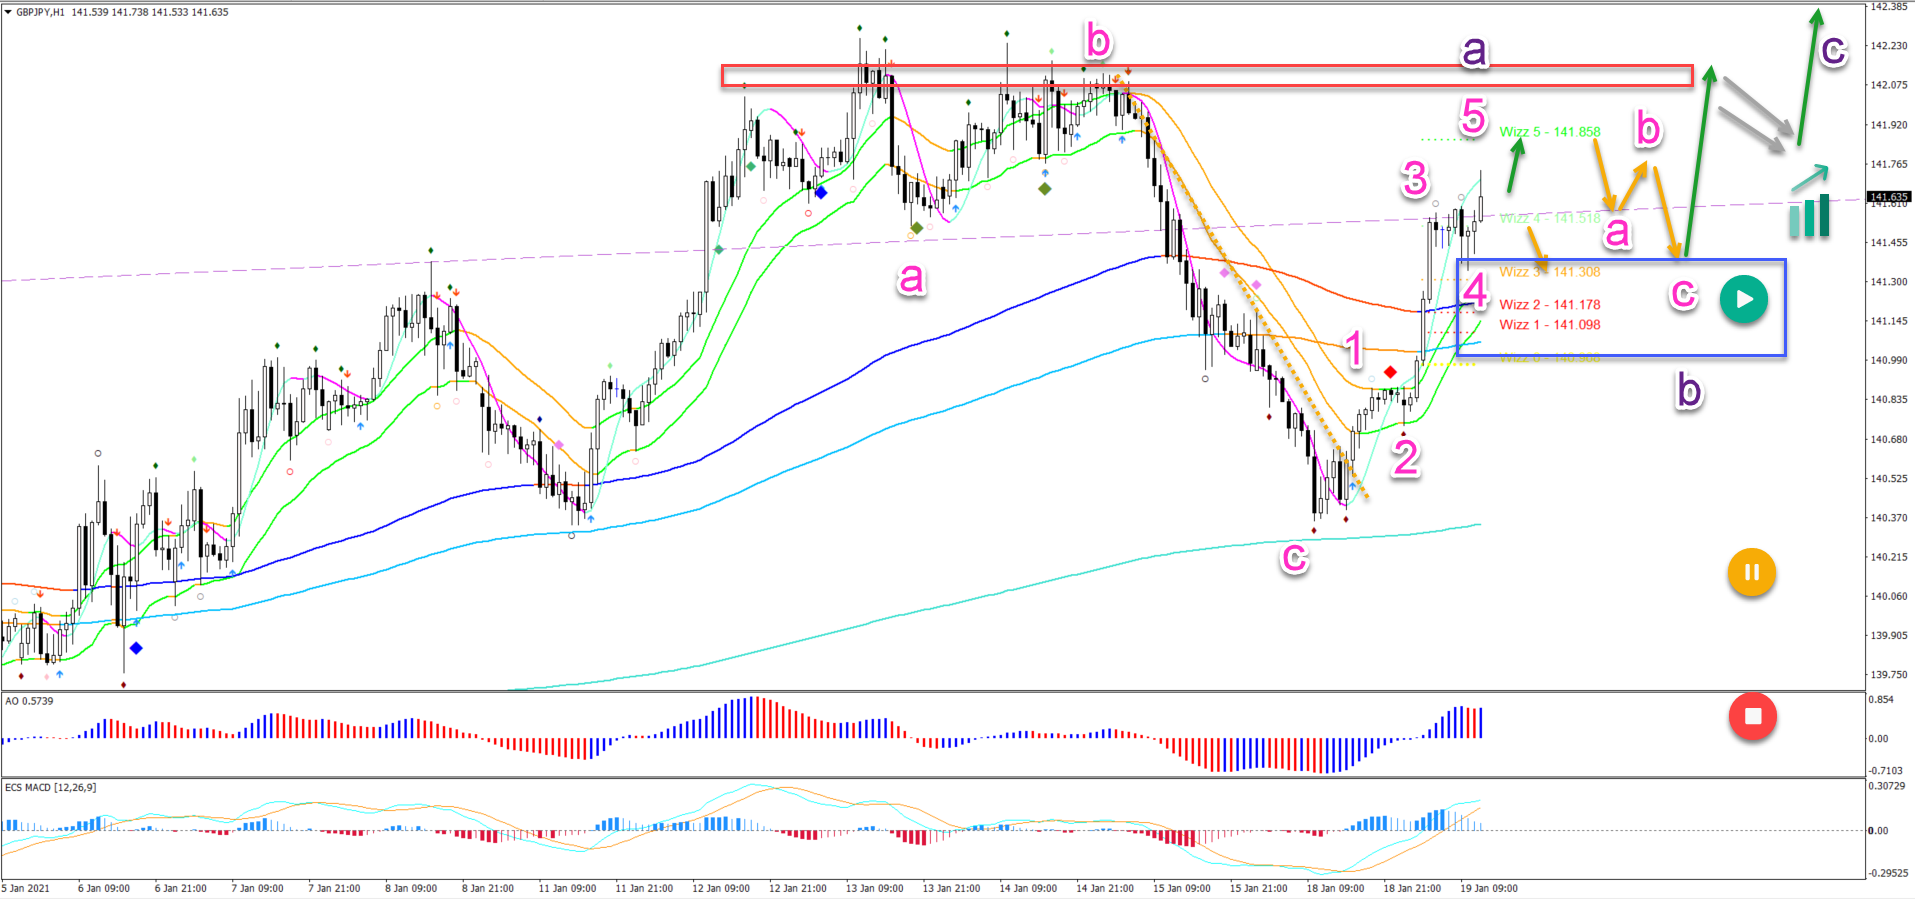
The GBP/JPY 1 hour chart seems to have completed a bearish ABC (pink) at the recent low. The current bullish price action is also unfolding in 5 waves. What does this mean?
It indicates that more upside is expected (green arrows) after price action completes an ABC (pink) down (orange arrows). The bearish retracement is expected after a bullish 5 wave pattern.
Once the ABC is finished, the bulls could retake control and push price action higher again within the larger uptrend (see moving averages).
Only a break below the previous bottom could indicate a pause of the uptrend (yellow and red circles).
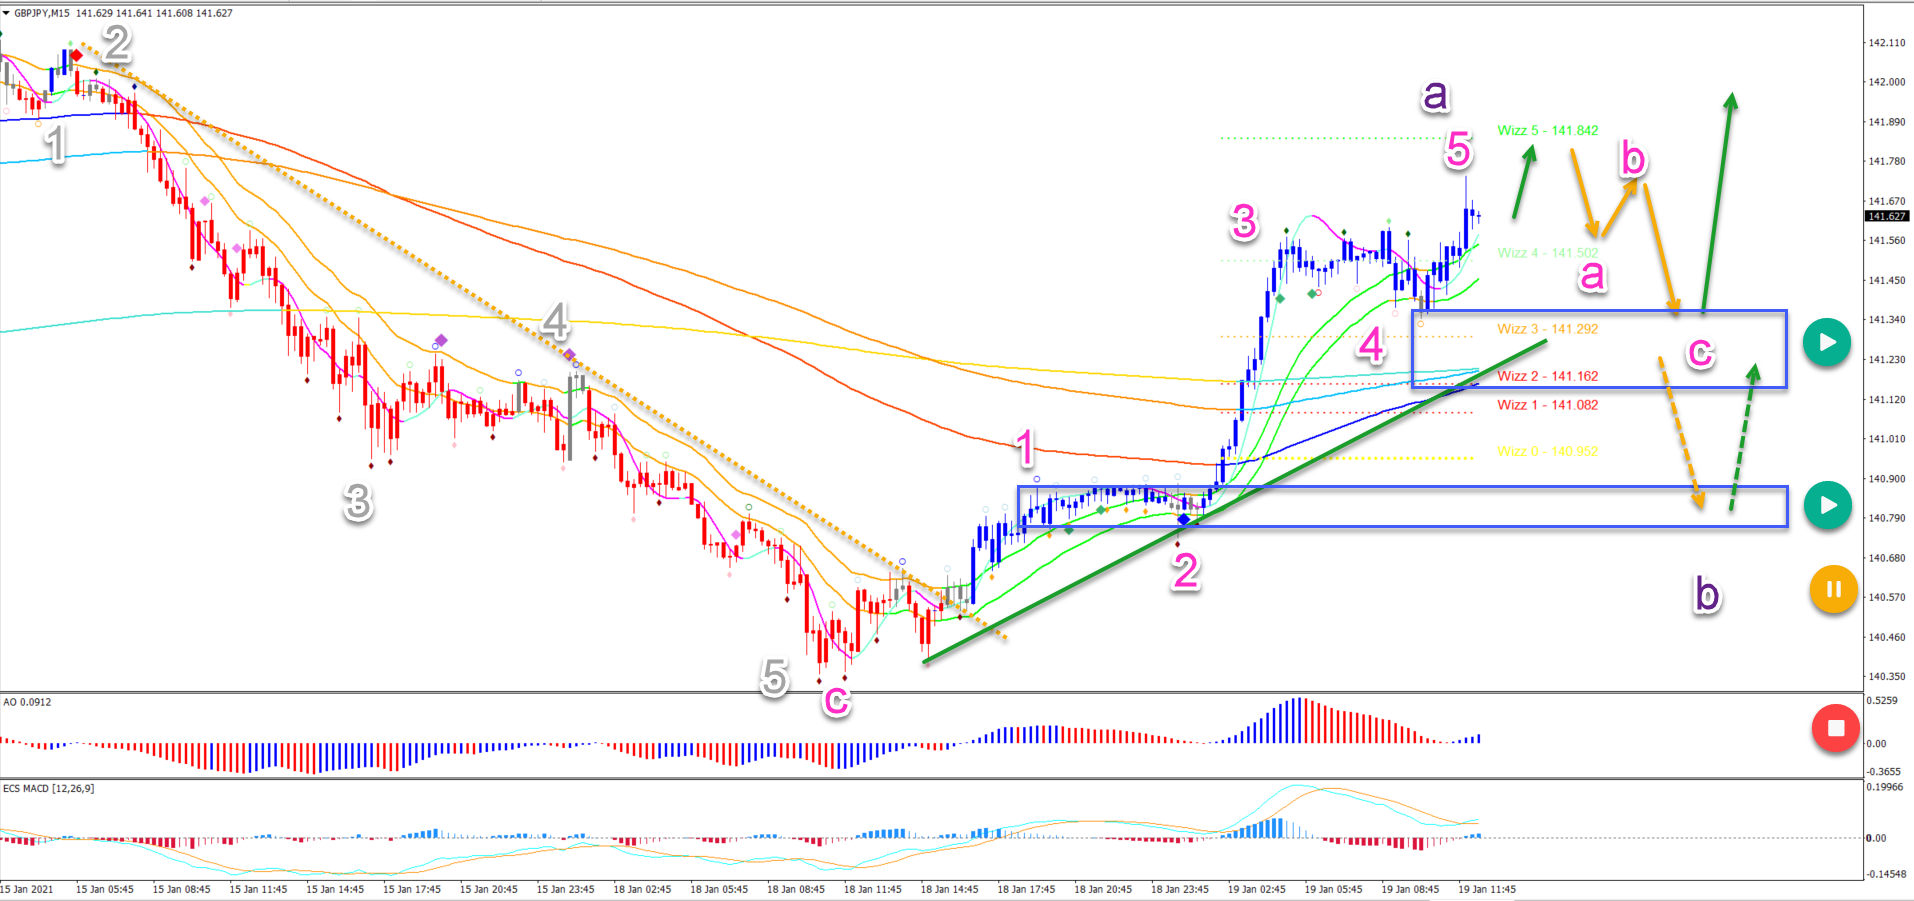
On the 15 minute chart, we can see the fluent bearish price action down (red candles) and up (blue candles).
The 5 wave down, however, seems to complete a larger wave C (pink) whereas the 5 wave up is probably part of a wave A (purple).
The ABC pattern remains valid as long as price action respects the support zones (blue boxes). The uptrend targets are located at:
- The previous top at 142.13
- The long-term top and Wizz 7 at 142.67
- A break of the top could indicate a move to 144
The analysis has been done with the indicators and template from the SWAT method (simple wave analysis and trading). For more daily technical and wave analysis and updates, sign-up to our newsletter.
Good trading,
Chris Svorcik


Leave a Reply