🔥 EUR/USD Strong Bearish Reversal But Fibonacci Resistance Must Hold 🔥

Dear traders,
the EUR/USD is testing the previous top (red box). Price action made a bearish bounce at the Wizz 8 target zone as expected.
Will the EUR/USD also make a larger bearish reversal or is the uptrend still active? Let’s review the Elliott Wave patterns.
Price Charts and Technical Analysis
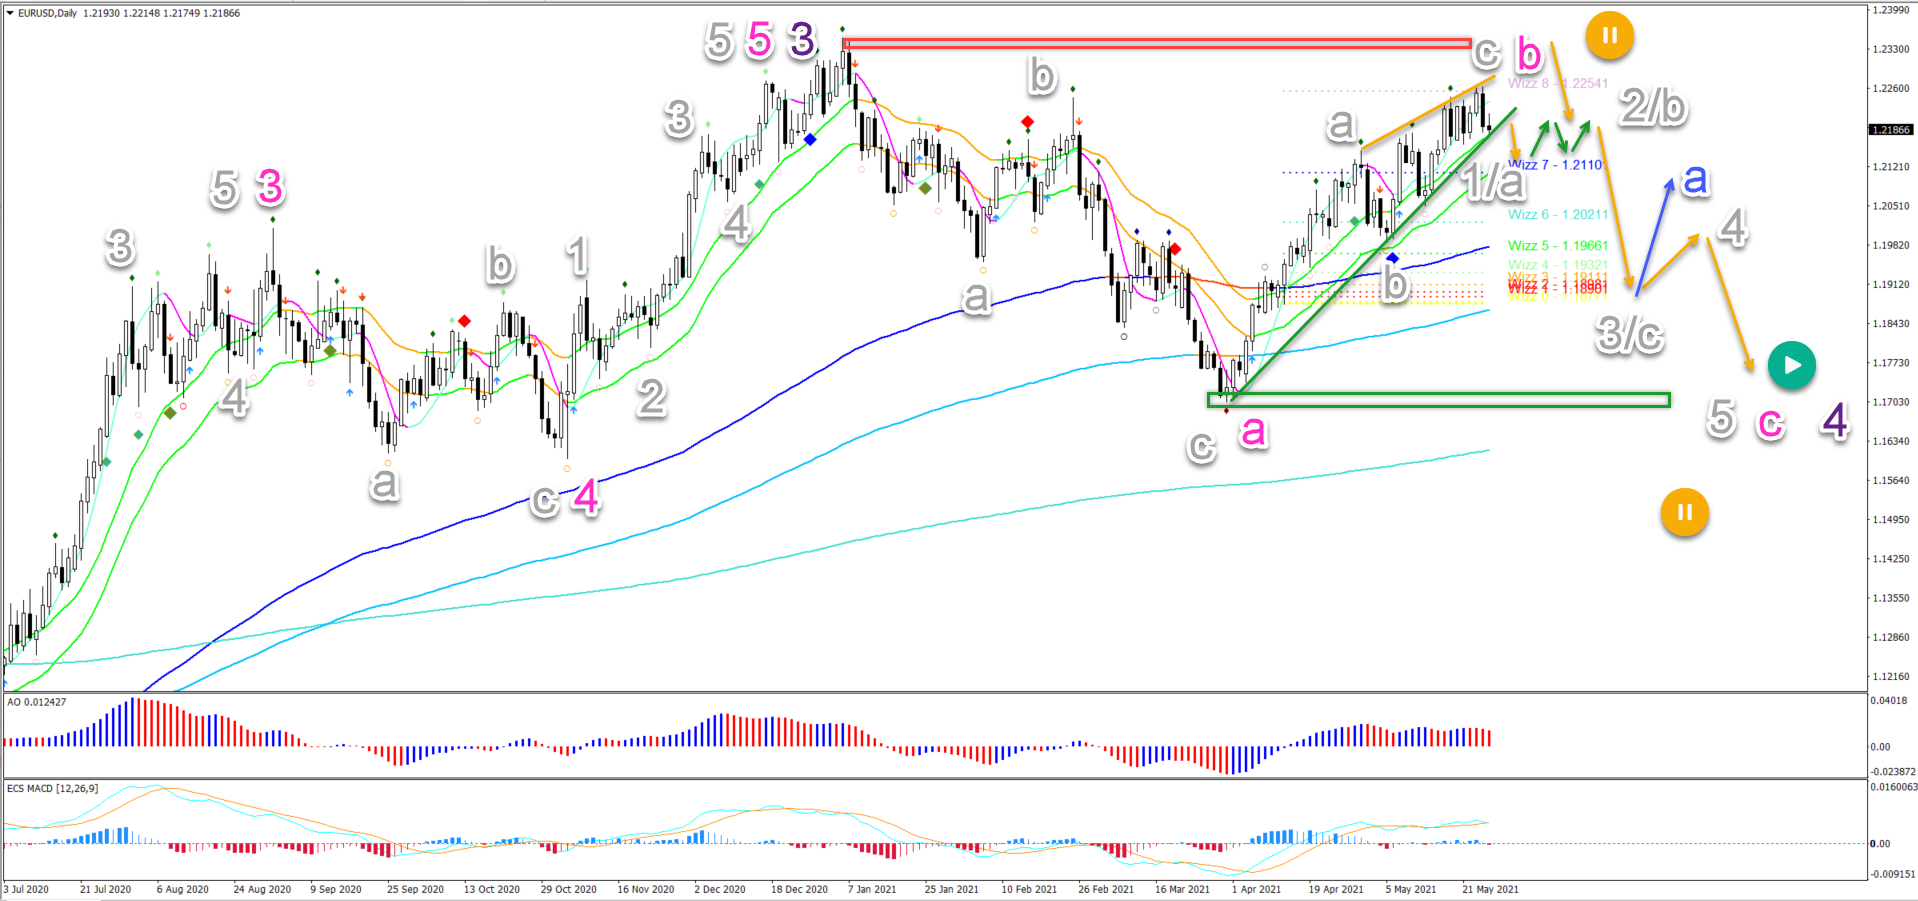
The EUR/USD bearish action seems to complete a bullish wave C (grey) in a bearish wave B (pink). A bearish reversal is therefore expected, let’s look at all of the angles:
- A rising wedge reversal chart pattern is visible (trend lines). A break below the support (green) line and the 21 ema zone would confirm the reversal.
- A bearish breakout could start the wave C (pink) correction in wave 4 (purple). Either a 3 wave ABC in a larger ABCDE triangle (pink) or 5 wave pattern in a larger ABC flat (pink) is expected.
- If price action does move up higher, then another bearish bounce (orange arrow) is expected at the previous high (red box).
- Only a significant break above the high places this wave outlook on hold (orange circle). A strong break below the bottom (green box) also makes the current wave outlook unlikely.
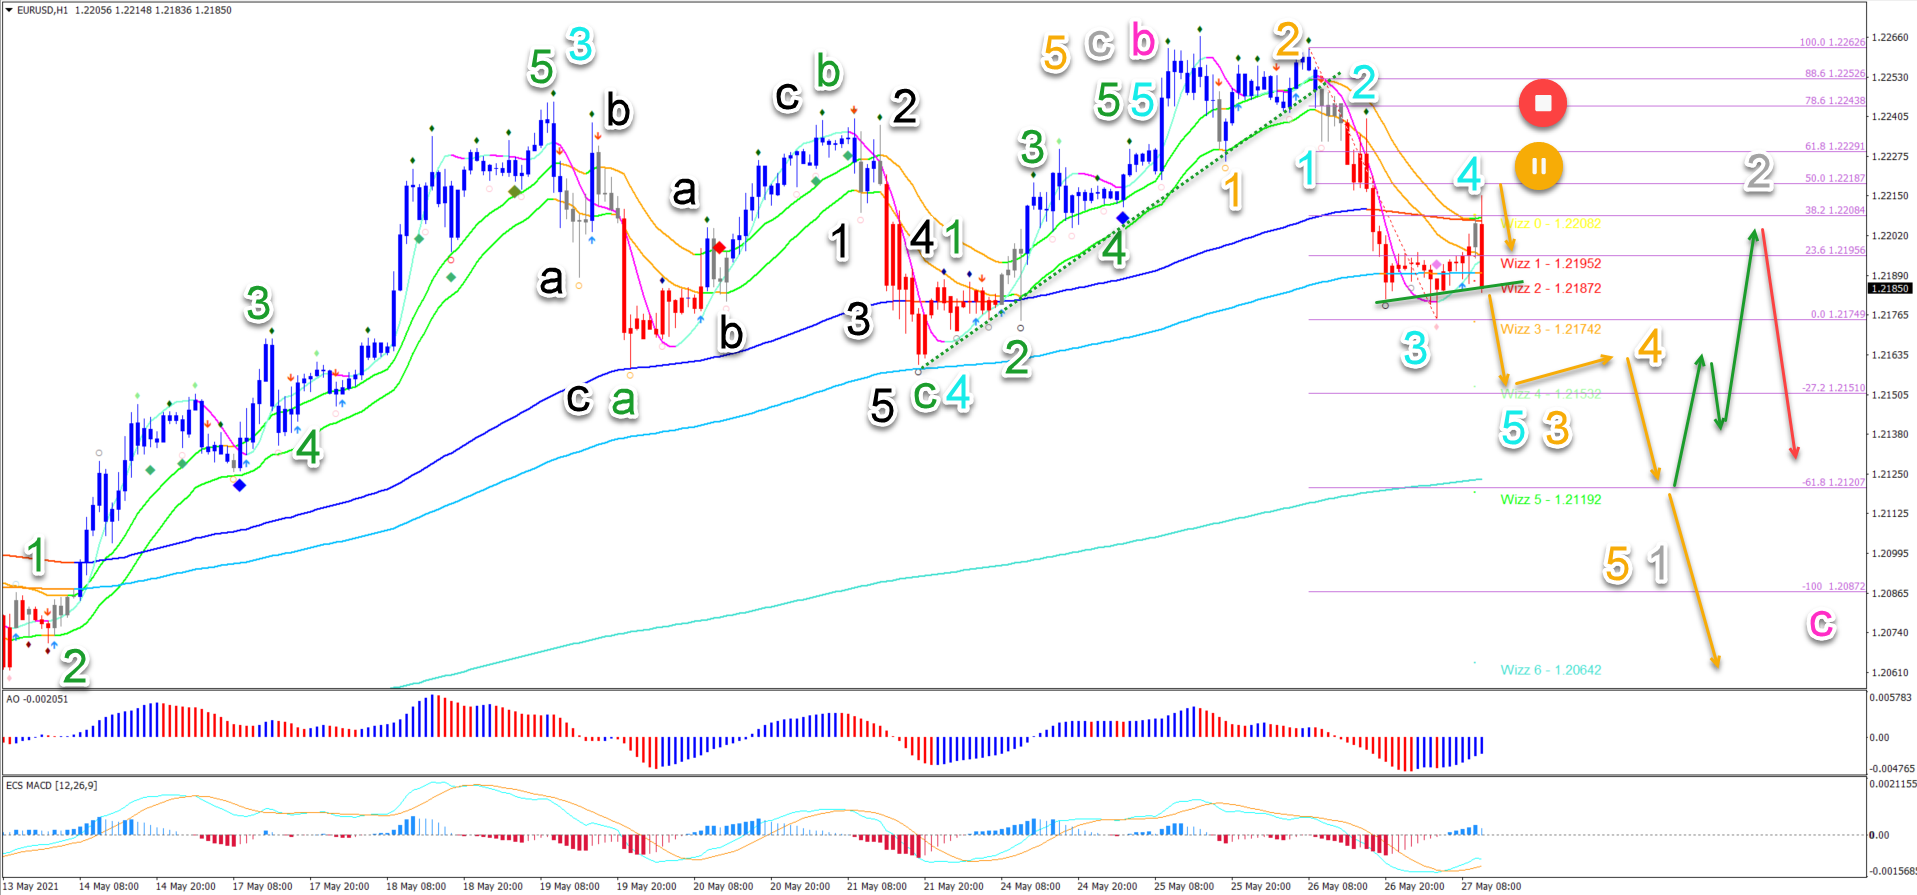
On the 1 hour chart, price action broke the 21 ema zone and support trend line (dotted green) as a confirmation of the reversal, as mentioned in our EUR/USD and GBP/USD video on Wednesday:
- The bearish reversal took place after price action completed an ABC (green) pattern in wave 4 (blue) before making a 5 wave (green) in wave 5 (blue).
- A bearish breakout confirms a larger bearish price swing after divergence patterns emerged on multiple time frames and a strong resistance zone was reached.
- The strong bearish impulse is probably some type of wave 3 (blue).
- The current pullback is expected to be a wave 4 (blue) as long as price action respects the Fibonacci retracement levels.
- A break above the 50% Fib (orange circle) however makes the current wave outlook less likely. A deep push up invalidates it (red circle). In that case, price action made a bearish ABC pattern rather than a 123.
- A break below the support could confirm the extension of the wave 3 (orange).
- The main targets are the Wizz 4, 5, and 6 levels and the Fibonacci targets.
- This could complete a wave 1 pattern (grey). A bullish ABC (green) pattern in wave 2 (grey) could emerge at these targets.
The analysis has been done with the indicators and template from the SWAT method (simple wave analysis and trading). For more daily technical and wave analysis and updates, sign-up to our newsletter.
Good trading,
Chris Svorcik


Leave a Reply