🔥 EUR/USD Challenging Key 50% Fibonacci Support Zone at 1.1825 🔥
November 19, 2020
3 min read

Dear traders,
The EUR/USD has been unable to break above the previous top. Price action is now testing the bottom of the 21 ema zone. This is a key decision zone for a bounce or breakout.
Price Charts and Technical Analysis
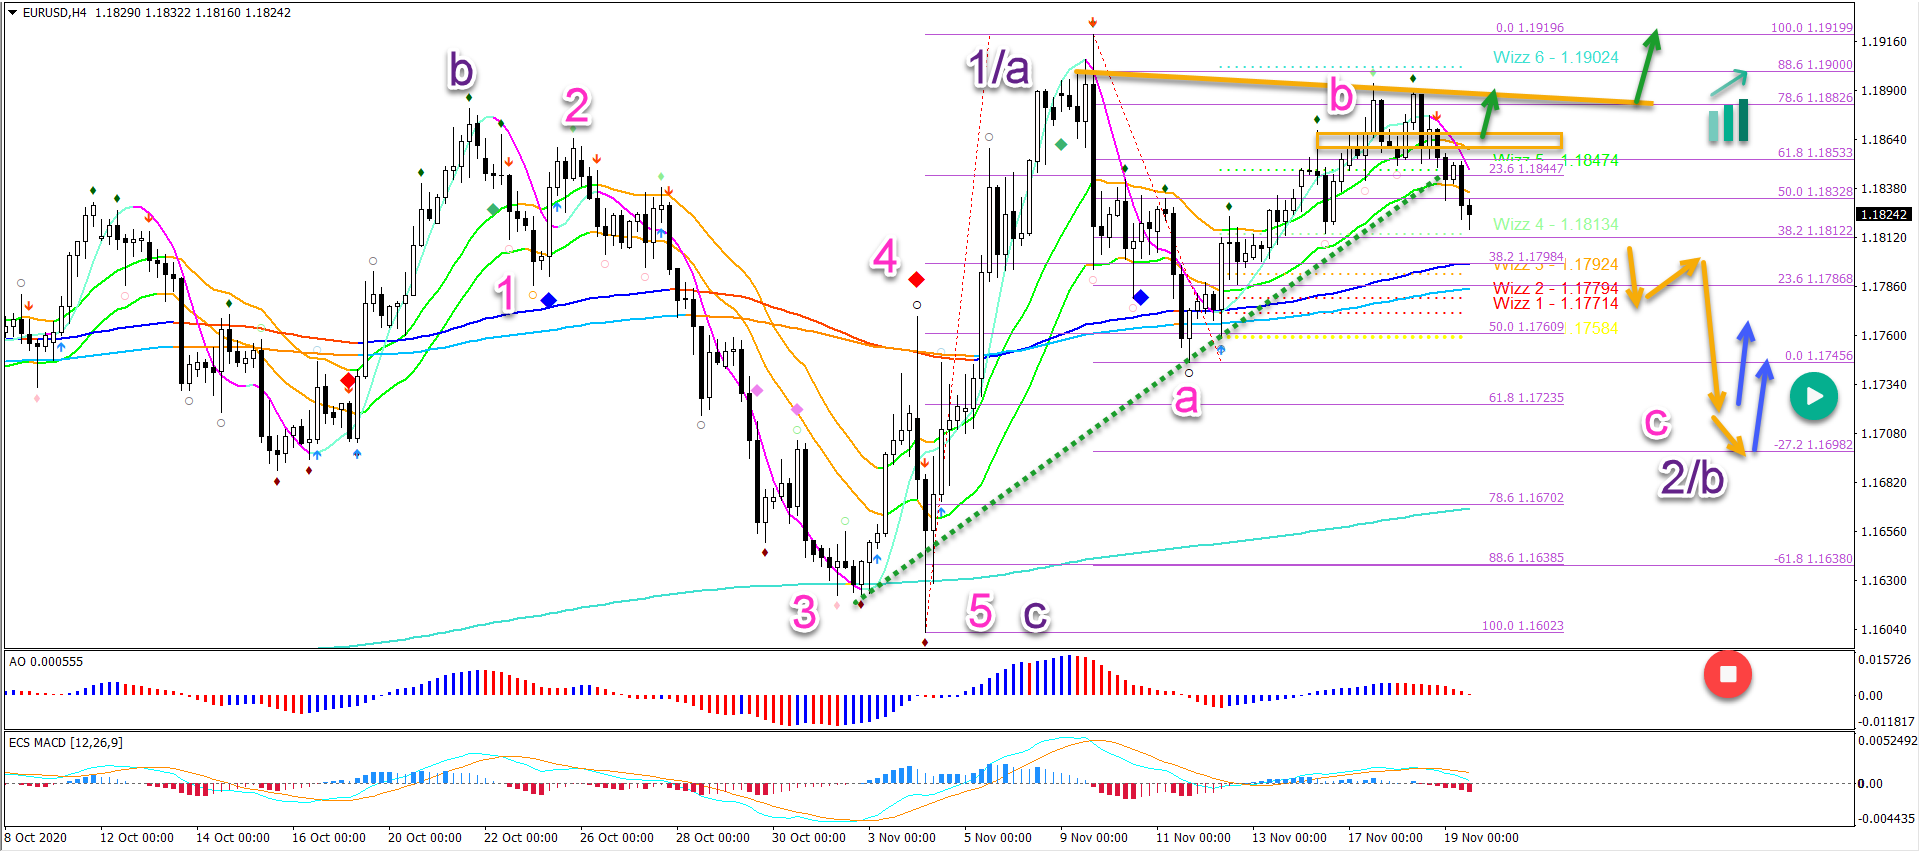
The EUR/USD break below the 144 ema confirms the end of the wave B (pink) and the bearish decline within wave C (pink).
- The main targets for the bears are the 61.8% and 78.6% Fibonacci retracement levels and the -27.2% target.
- A bounce at the Fibs (blue arrow) could confirm the bullish wave pattern (purple).
- A bearish breakout below the previous bottom at 1.1602 invalidates (red circle) the bullish wave 1/a and 2/b pattern (purple).
A bullish breakout above the resistance could indicate a surprise turn for an immediate upside (green arrows).
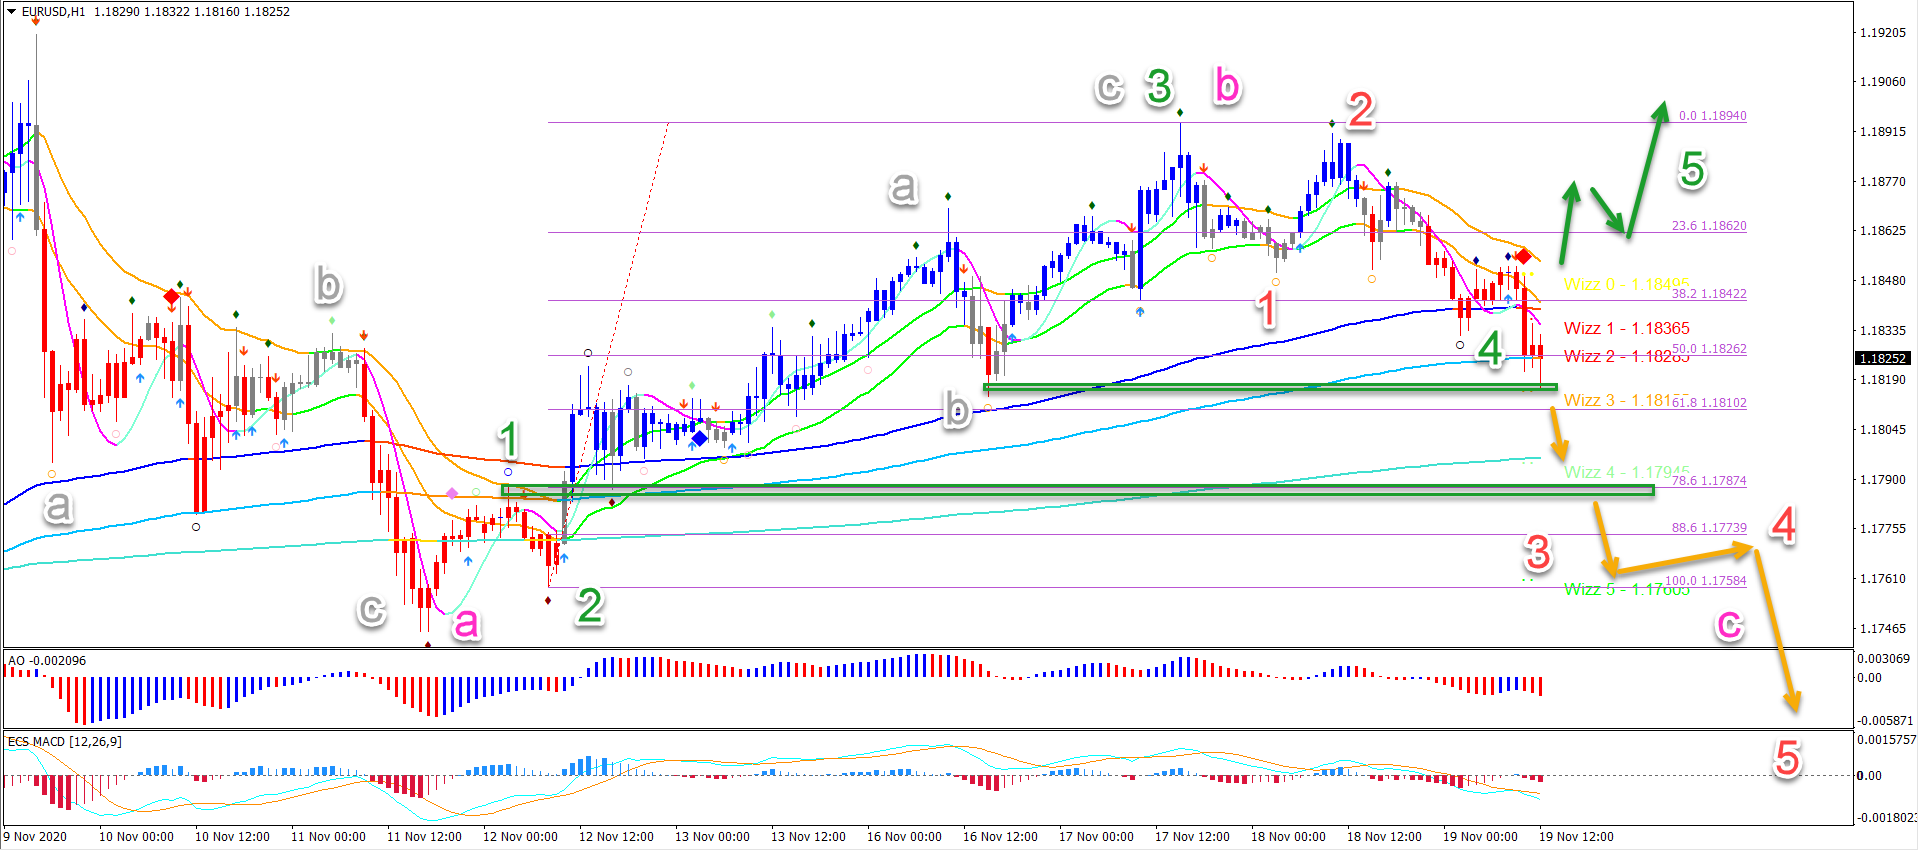
On the 1 hour chart, price action seems to be breaking below the 50% Fibonacci level.
- If price pushes below this Fib level and the top of wave 1 (green box), then the 5 wave pattern (green) is invalid.
- In that case, a bearish 5 wave (red) pattern is likely to take price action lower within wave C (pink).
- A bullish bounce at these Fibs without breaking support (green box) and then followed by a bullish breakout could indicate a wave 5 (green arrows)
The analysis has been done with the indicators and template from the SWAT method (simple wave analysis and trading). For more daily technical and wave analysis and updates, sign-up to our newsletter.
Good trading,
Chris Svorcik


Leave a Reply