🎯 EUR/USD Bullish Momentum After Hitting 38.2% Fib at 1.17 Aims at 1.2250 🎯

Dear traders,
the EUR/USD is building a bullish reversal at the 38.2% Fibonacci support level around 1.17. The bearish correction is therefore probably over.
This article reviews what price patterns and targets to expect.
Price Charts and Technical Analysis
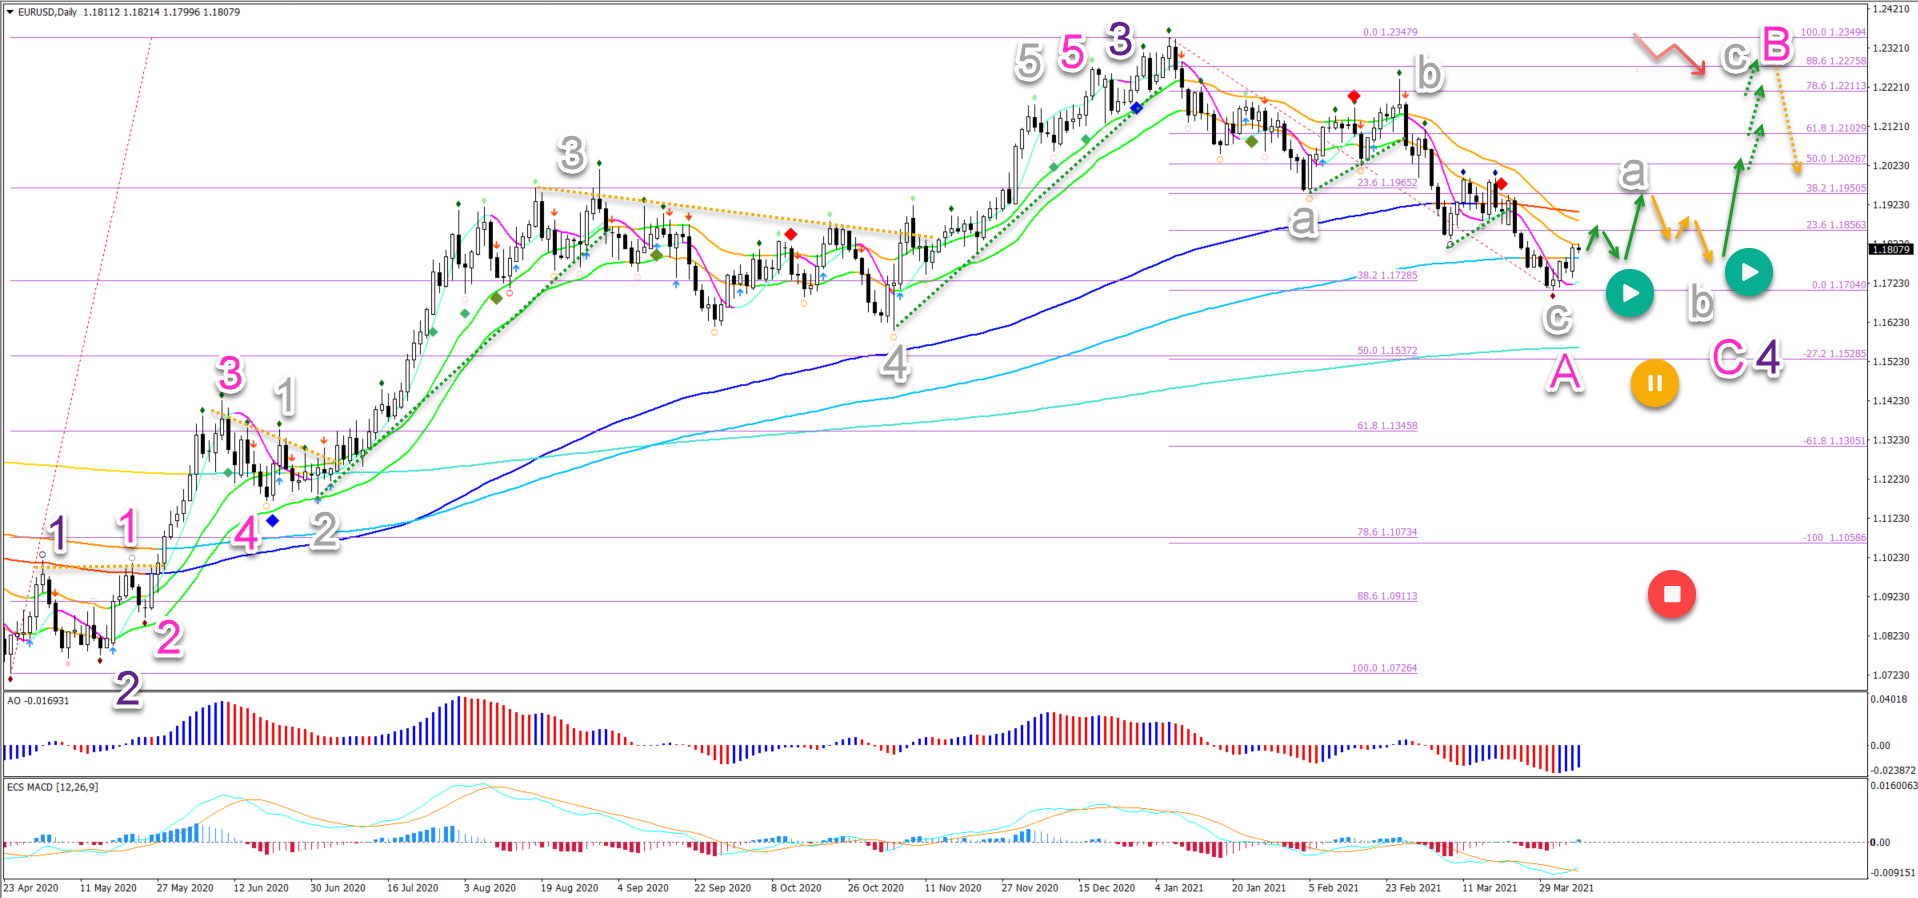
The EUR/USD bears pushed price action lower from a high at 1.2348 to a recent low around 1.17. But now bullish daily candlesticks have appeared at the 38.2% Fibonacci support level.
- The bullish bounce at the 38.2% Fib could confirm the wave 4 (purple) pattern mentioned before.
- Waves 4 are usually shoppy and lengthy so wave 4 (purple) is probably not completed as yet. A bearish ABC or ABCDE (pink) pattern will probably emerge.
- A bearish ABC (grey), however, does seem to complete the first wave A (pink).
- A bullish bounce (green arrows) is therefore likely to test the deep 88.6% Fibonacci level or previous top. A bullish ABC (grey) pattern is expected.
- A bearish bounce at the resistance (dotted orange arrows) could confirm the end of the wave B (pink).
- The wave 4 remains intact as long as price stays above the 50% Fib. A deeper pullback places it on hold (yellow circle) or invalidates it (red circle).
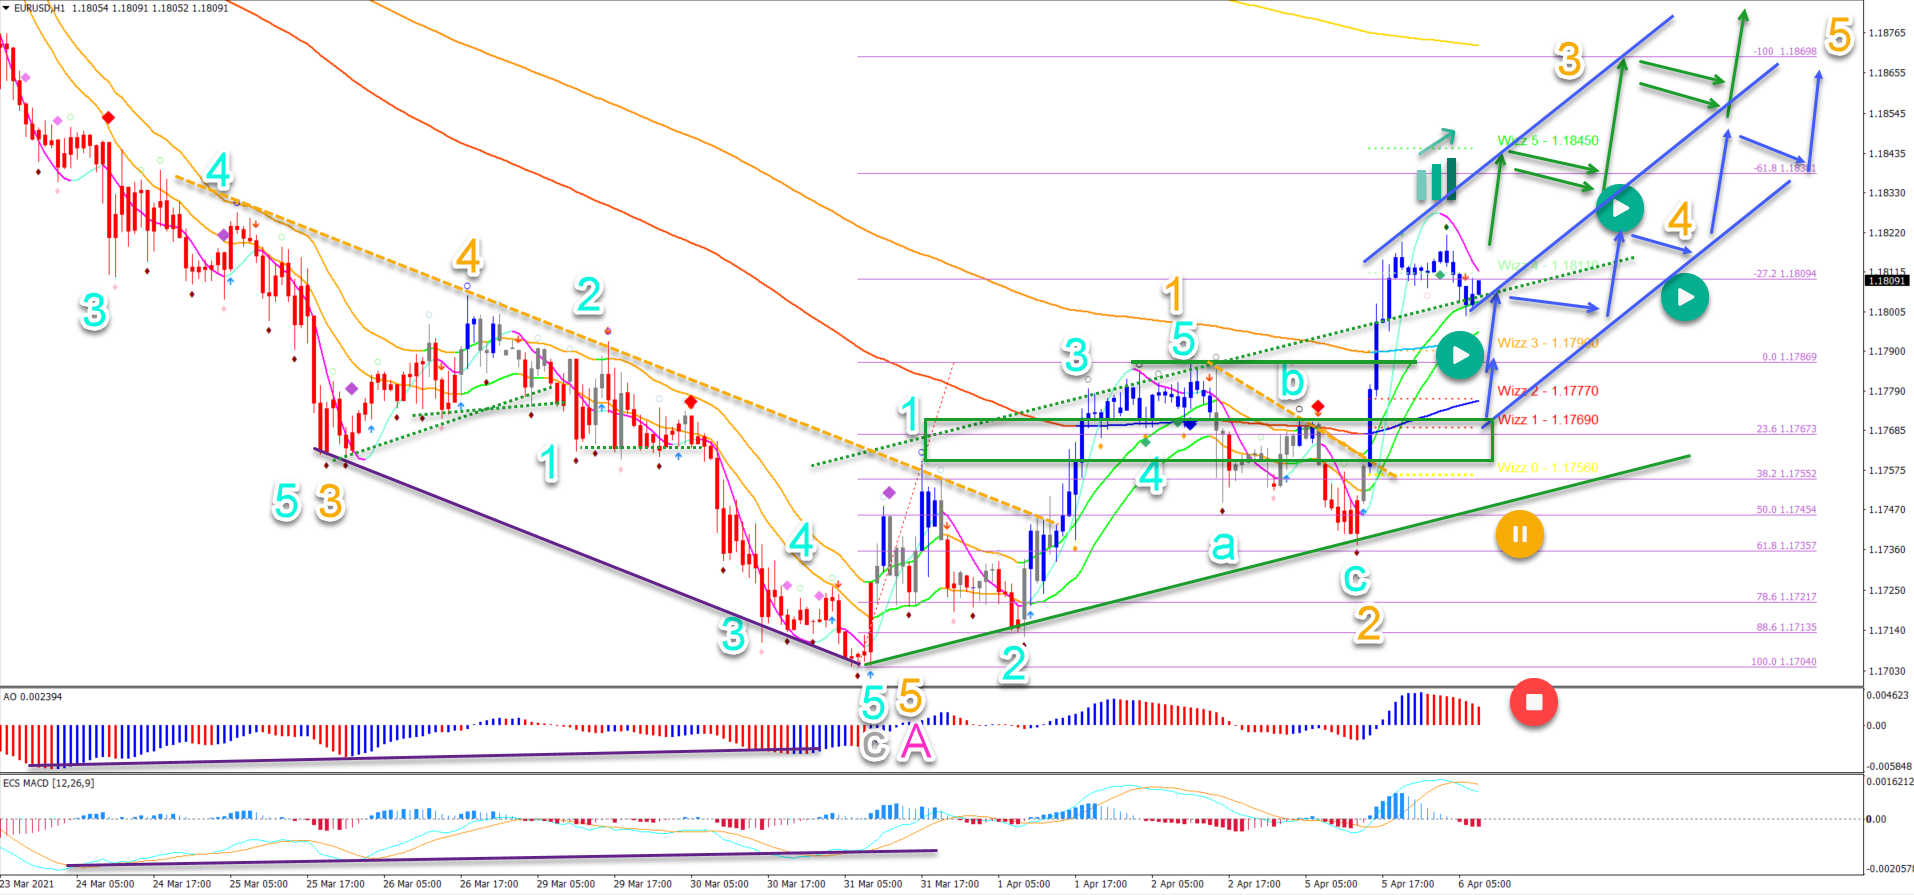
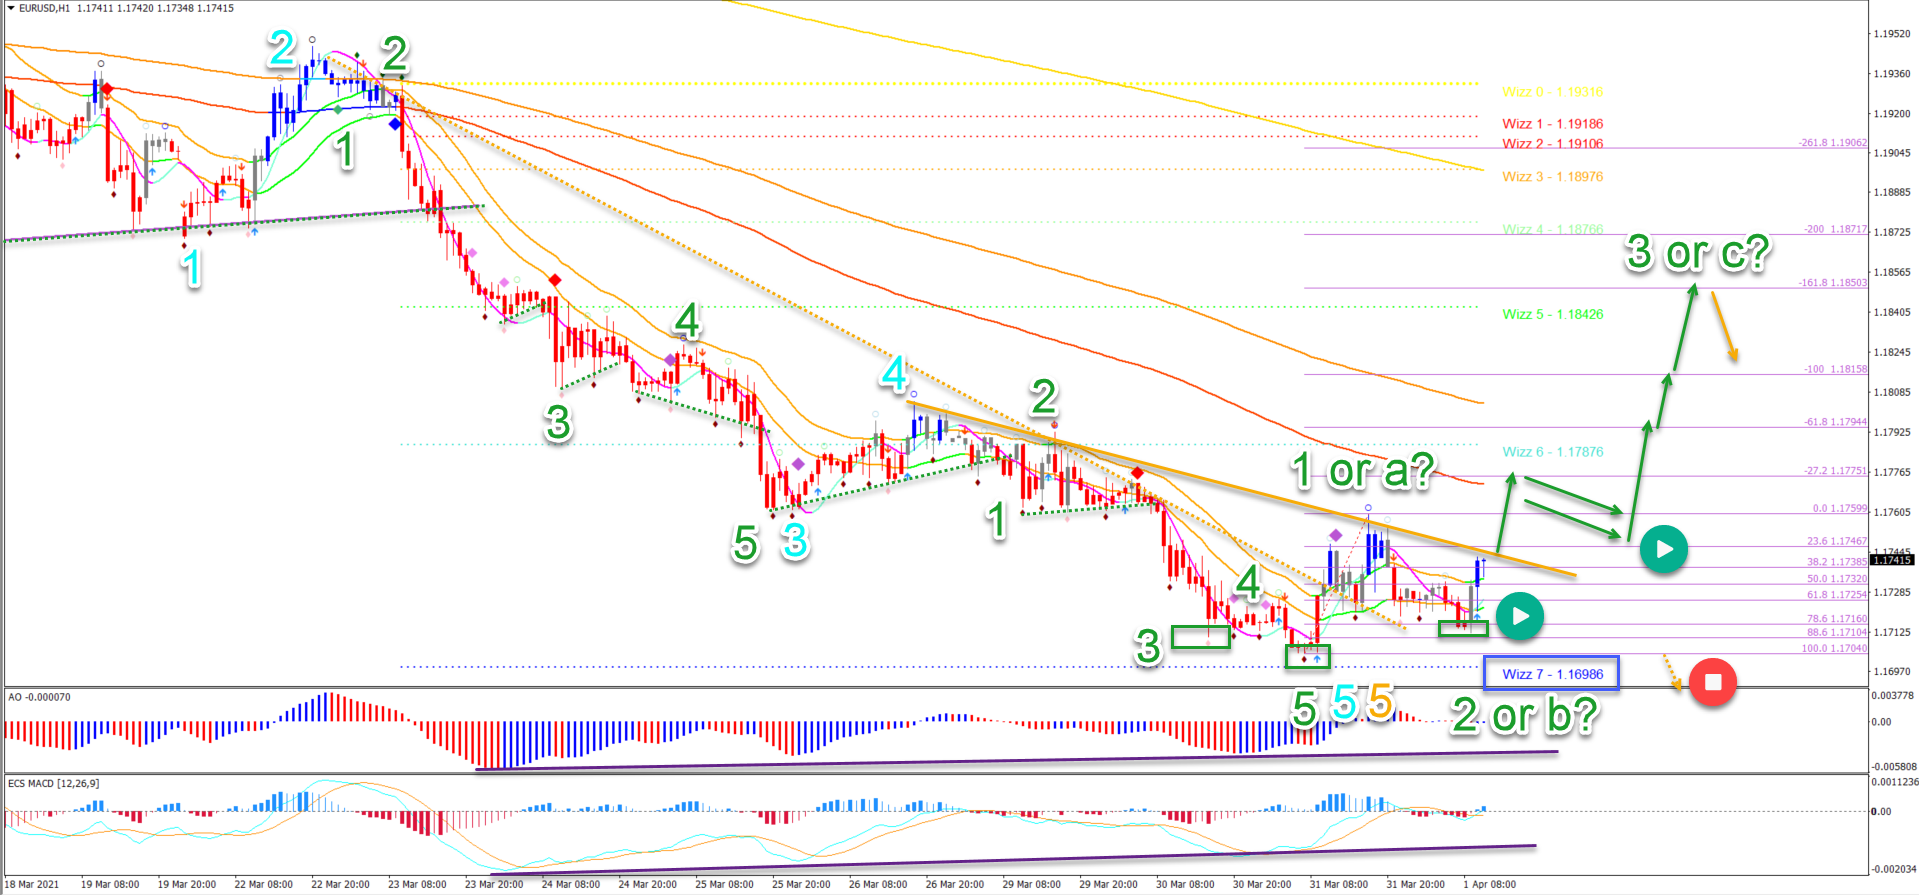
On the 1 hour chart, price action is already showing signs of reversal for a while, as mentioned in my EUR/USD and GBP/USD video analysis.
- The divergence pattern (purple) lines between price action and the oscillators on both the 1 and 4 hour charts indicated the need for a bullish retracement.
- A strong impulsive move up was seen after price hit the critical 38.2% Fib at the 1.17 support zone (daily chart).
- The bullish impulse was either a wave 1 or A and likely to see more upside.
- The bullish breakout above the resistance trend line (dotted orange) was a first indication that the downtrend was over…
- … But the 5 wave pattern (blue) that emerged indicates more upside as price action is building a larger wave 1 (orange).
- The wave 2 retracement (orange) respected the 61.8% Fibonacci level and the bullish uptrend channel (green lines).
- Price made a strong bounce up again, which is probably a wave 3 (orange).
- Price action is expected to either bounce (blue arrows) at the support zone (green box) or make an immediate bullish breakout (green arrows) towards the Fibonacci targets.
- Bull flag patterns could appear and breaks above those flags could confirm the uptrend continuation.
The analysis has been done with the indicators and template from the SWAT method (simple wave analysis and trading). For more daily technical and wave analysis and updates, sign-up to our newsletter.
Good trading,
Chris Svorcik


Leave a Reply