🎯 EUR/USD Bullish ABC Zigzag Aims at Fibonacci Targets 🎯

Dear traders,
the EUR/USD is showing signs of indecision: the bearish price action was stopped at the 1.20 support level and trend lines (green). What is going on with this pair?
This article analyses the corrective zone in more detail. We explain what to expect in terms of Fibonacci levels and price patterns.
Price Charts and Technical Analysis
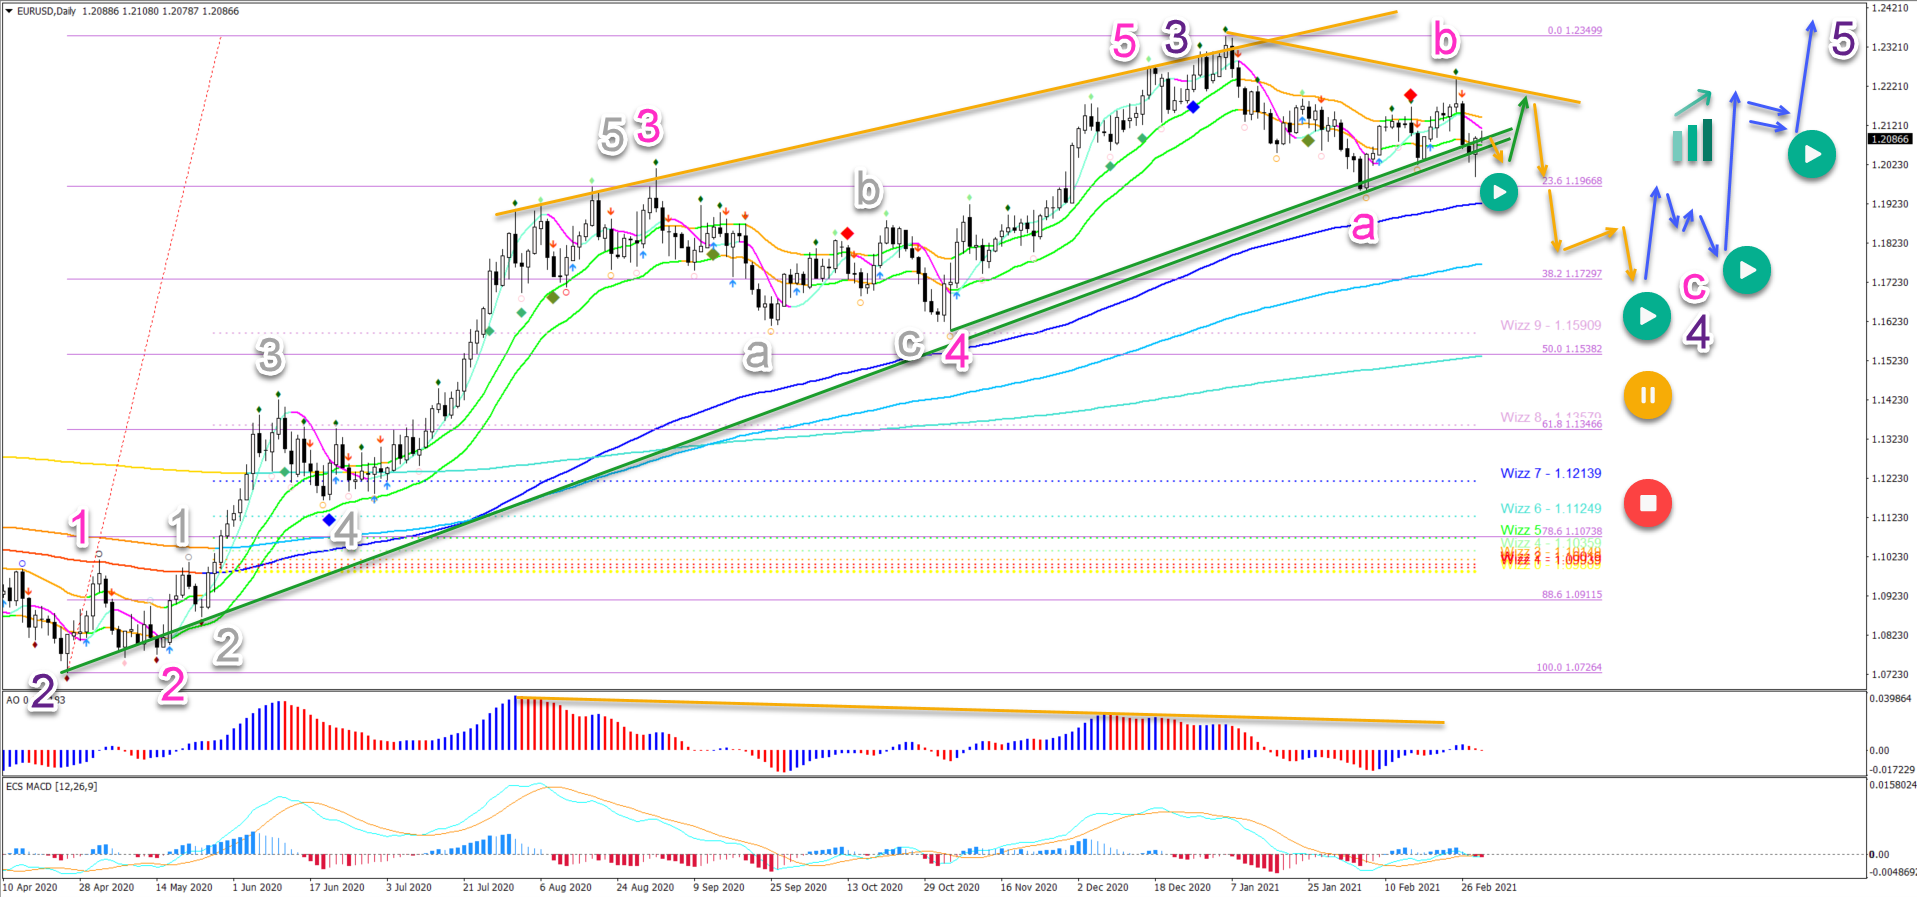
The EUR/USD made a bullish bounce as expected in our EU-GU video earlier this week. The bounce created a bullish daily candle yesterday. Let’s review the daily chart first:
- The recent bullish price swing is a wave B (pink) of a larger ABC zigzag (more likely) or ABCDE triangle pattern (less likely).
- A bearish bounce (orange arrow) at the resistance could confirm 1 of the 2 patterns.
- A bearish break (orange arrow) below the 23.6% Fibonacci level confirms the ABC zigzag pattern.
- A bearish break (orange arrow) aims at the next key 38.2% Fibonacci level at 1.1730.
- A bullish bounce (blue arrow) confirms the end of the wave C (pink) of the wave 4 (purple).
- A deeper bearish swing places the uptrend on hold (yellow circle) or invalidates it (red circle).
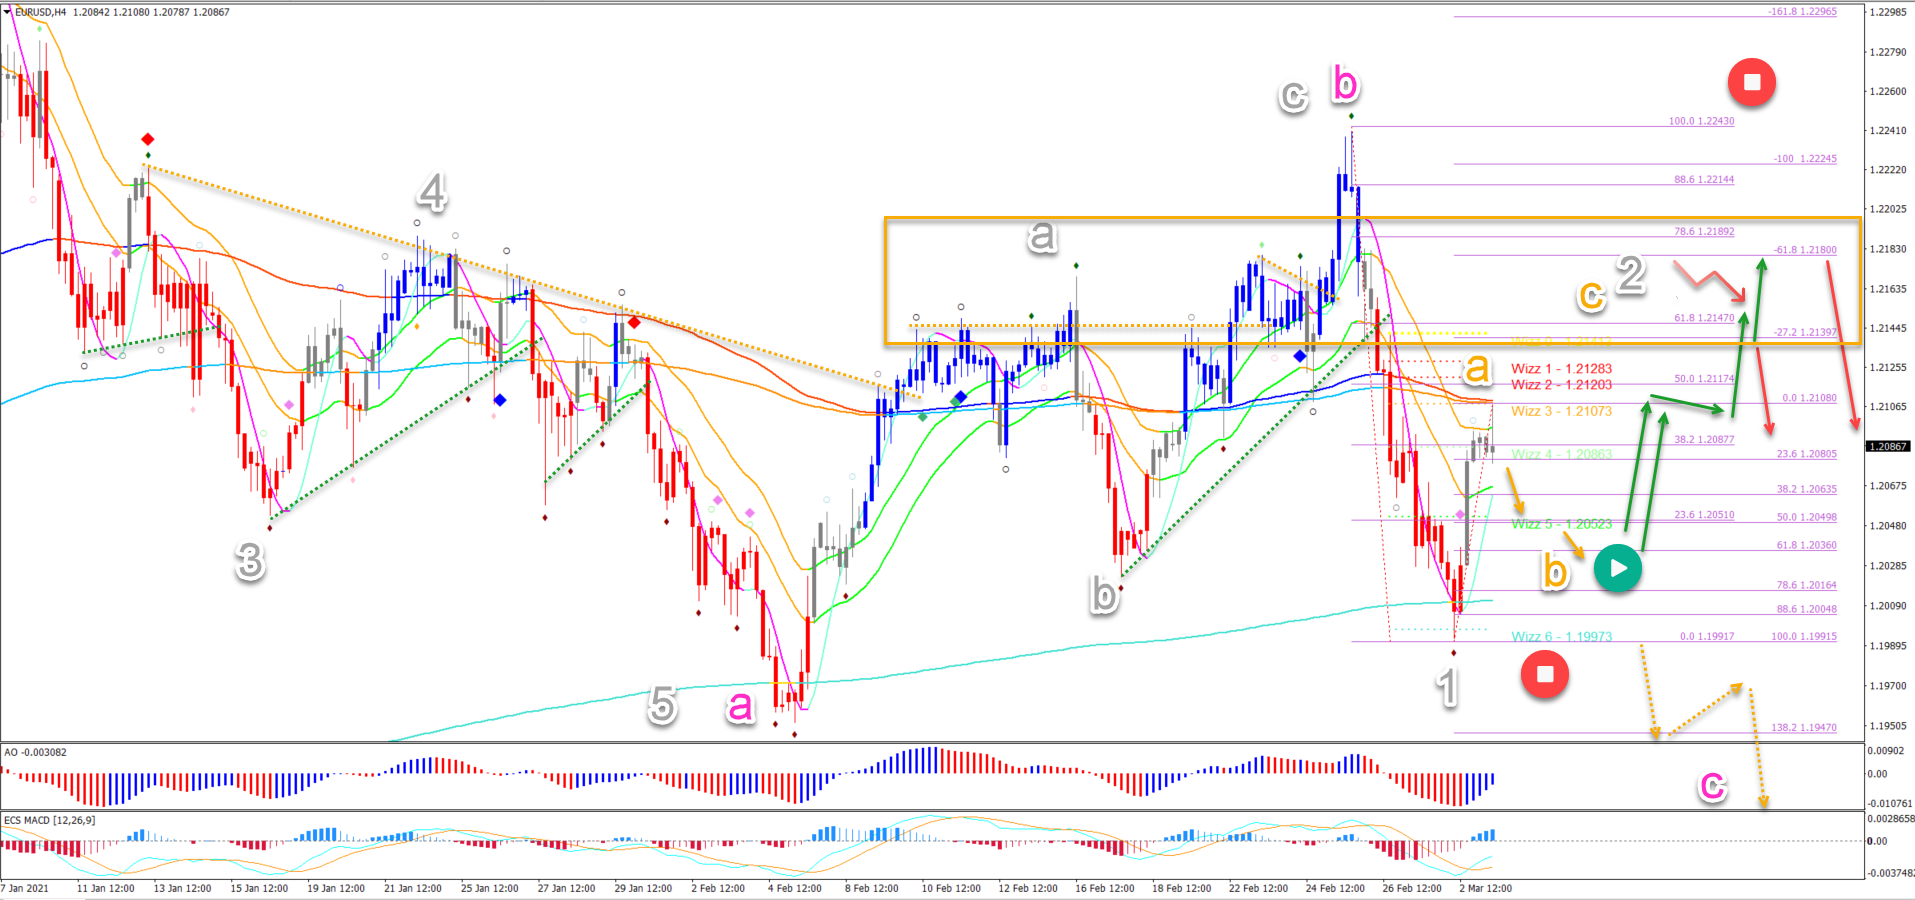
On the 4 hour chart, we see that price action completed a 5 wave pattern (grey) within wave A (pink). It was followed by a bullish ABC (grey) in wave B (pink).
The current drop was expected and the wave 1 (grey) reached the 1.20 target.
- The bullish bounce was strong at 1.20. This suggests a wave A (orange) of a larger ABC (orange) in wave 2 (grey).
- A bearish bounce (red arrows) is expected at the Fibonacci levels.
- A break above the top invalidates the wave 2 (grey).
- A break below the bottom without a 3rd swing up invalidates the ABC pattern.
- A bearish breakout below the bottom indicates a deeper wave C (pink).
- The arrows indicate the current expected price path.
The analysis has been done with the indicators and template from the SWAT method (simple wave analysis and trading). For more daily technical and wave analysis and updates, sign-up to our newsletter.
Good trading,
Chris Svorcik


Leave a Reply