? EUR/USD Bullish ABC at High Volume Support Zone ?

Dear traders,
the EUR/USD is testing a critical support zone. A bullish bounce could confirm an inverted head and shoulders pattern (blue boxes). The break below support or above resistance will be a key aspect for the direction of the next price swing.
Price Charts and Technical Analysis
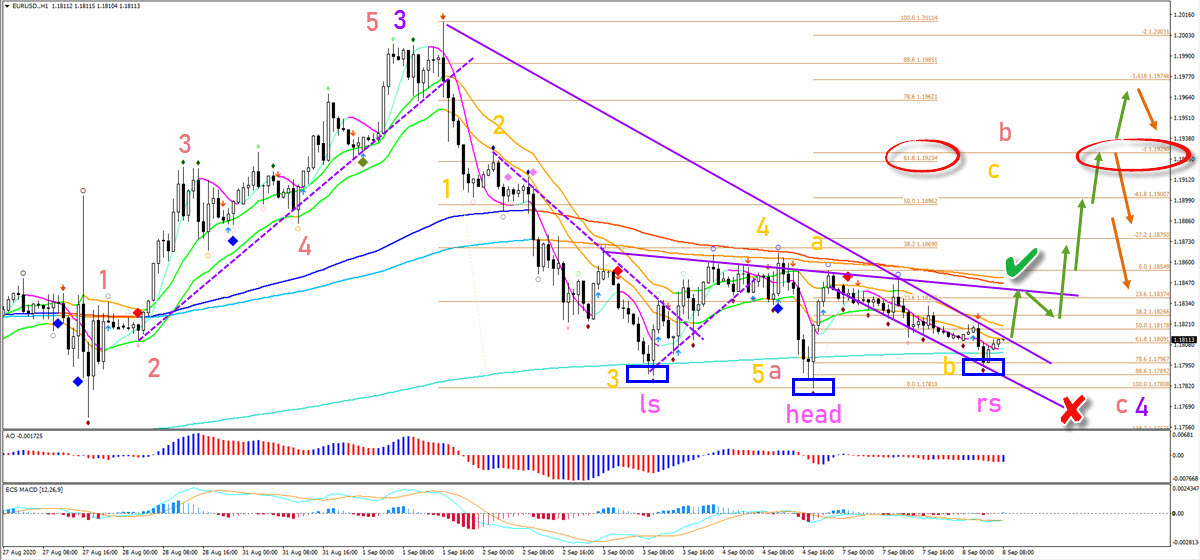
The EUR/USD bullish rebound at the Fibonacci levels could confirm a wave B (orange). But price action must stay above the 100% Fib level, otherwise the ABC zigzag pattern is invalid (red x). A breakout above the resistance trend lines and long-term moving averages would confirm the bullish breakout. This could also confirm the wave C (orange) of a larger wave B (red). Price is expected to respect the Fibonacci targets.
In the image below traders can also see the 4 hour perspective including volume profile. The current level has seen huge levels of volume. This increases the chance of price using it as a support zone. But if a bearish breakout does take place, then there is plenty of space to fall towards 1.17 and the larger 23.6% Fibonacci level of wave 4 (pink). A break through that Fib means that price can extend its fall towards the 38.2% Fib and 1.15 round level. A bullish bounce could target the head and shoulders level (red boxes).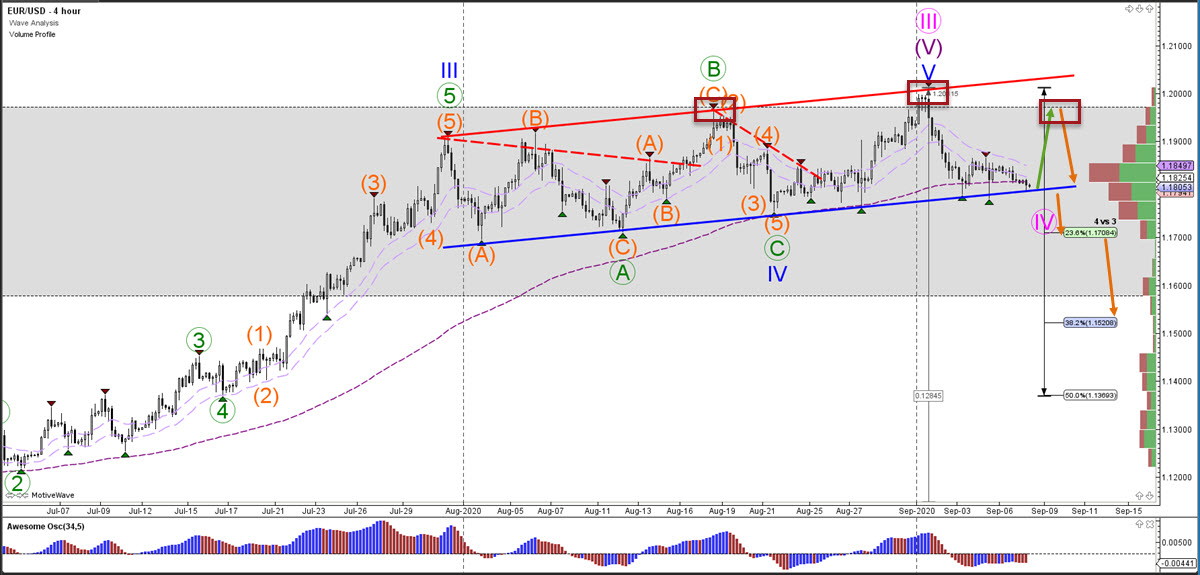
The analysis has been done with the indicators and template from the SWAT method (simple wave analysis and trading). For more daily technical and wave analysis and updates, sign-up to our newsletter.
Good trading,
Chris Svorcik


Leave a Reply