🚀 EUR/USD Bull Flag Pattern in Wave 4 in Strong Uptrend 🚀

Dear traders,
the EUR/USD showed a massive bullish price swing last week. The bulls were even able to reach the Wizz 8 level.
Can we expect an uptrend to continue? Let’s review the key price patterns and the path of least resistance.
Price Charts and Technical Analysis
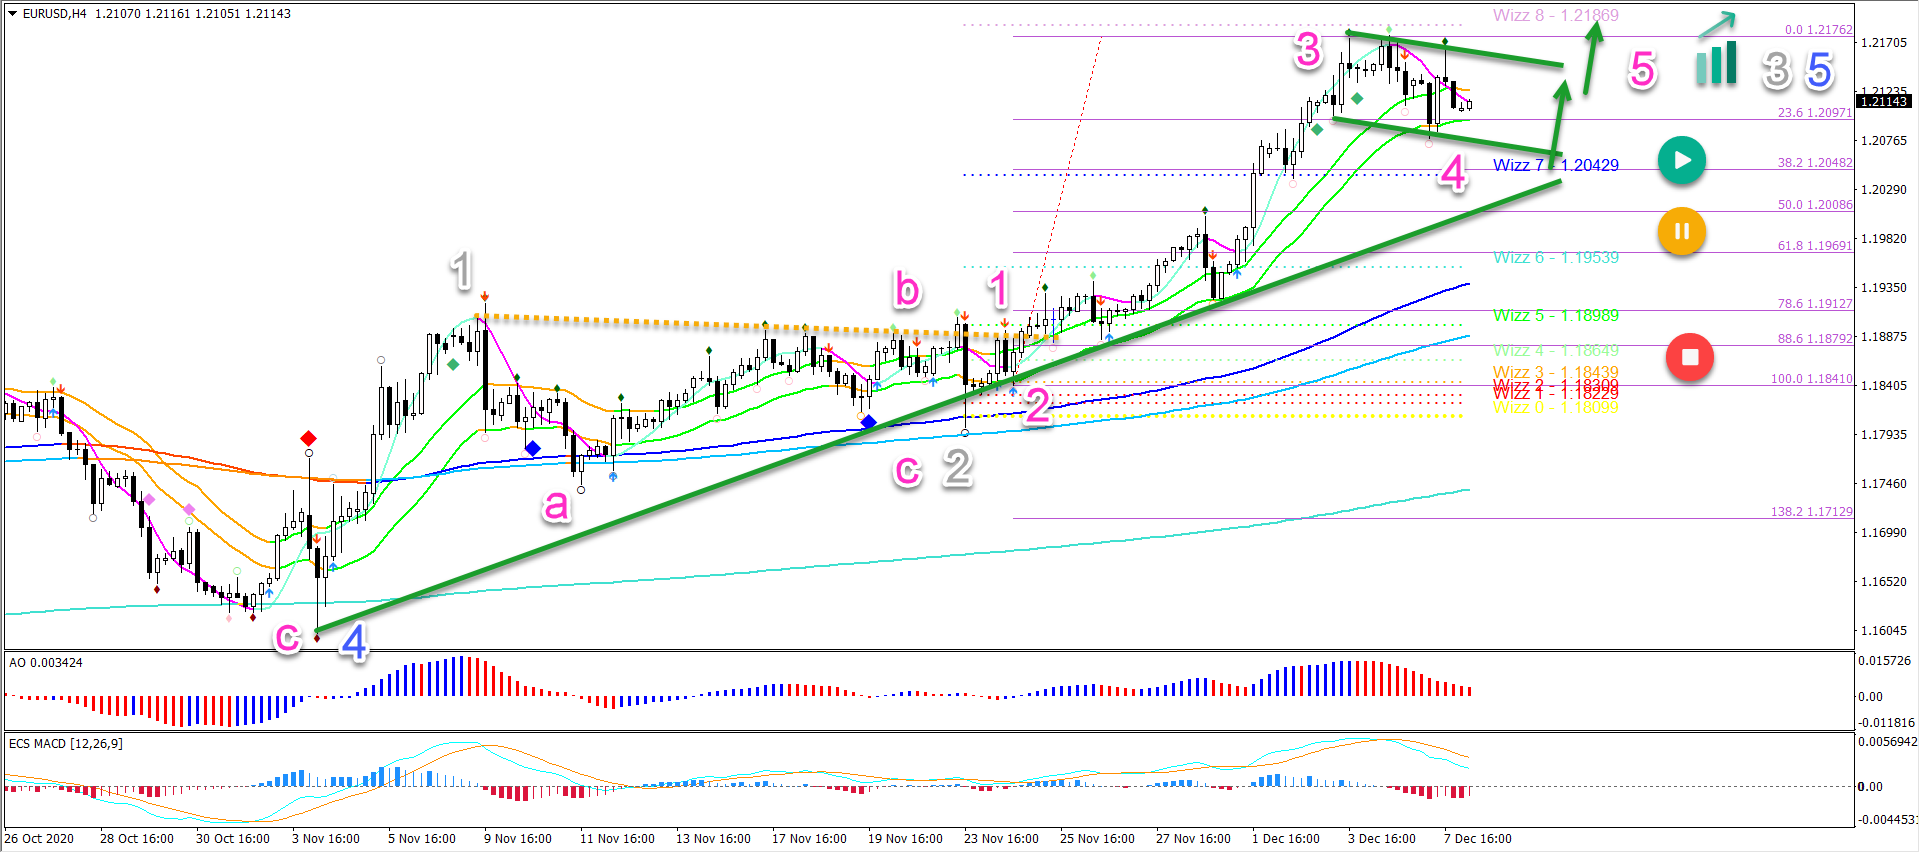
The EUR/USD uptrend is currently very strong. For instance, price action has pulled away from the 21 ema and 144 ema zones in an impressive fashion. Therefore, the current bullish swing is likely a wave 3 (pink) – and not a wave C.
This wave outlook remains valid as long as price action stays above the 50% Fibonacci retracement level. A break below the 50% Fib places the uptrend on hold (yellow) or invalidates it (red).
A bullish bounce at the Fibs or break above the bull flag confirm the uptrend continuation. The main targets are at 1.2250, 1.2375, and 1.25.
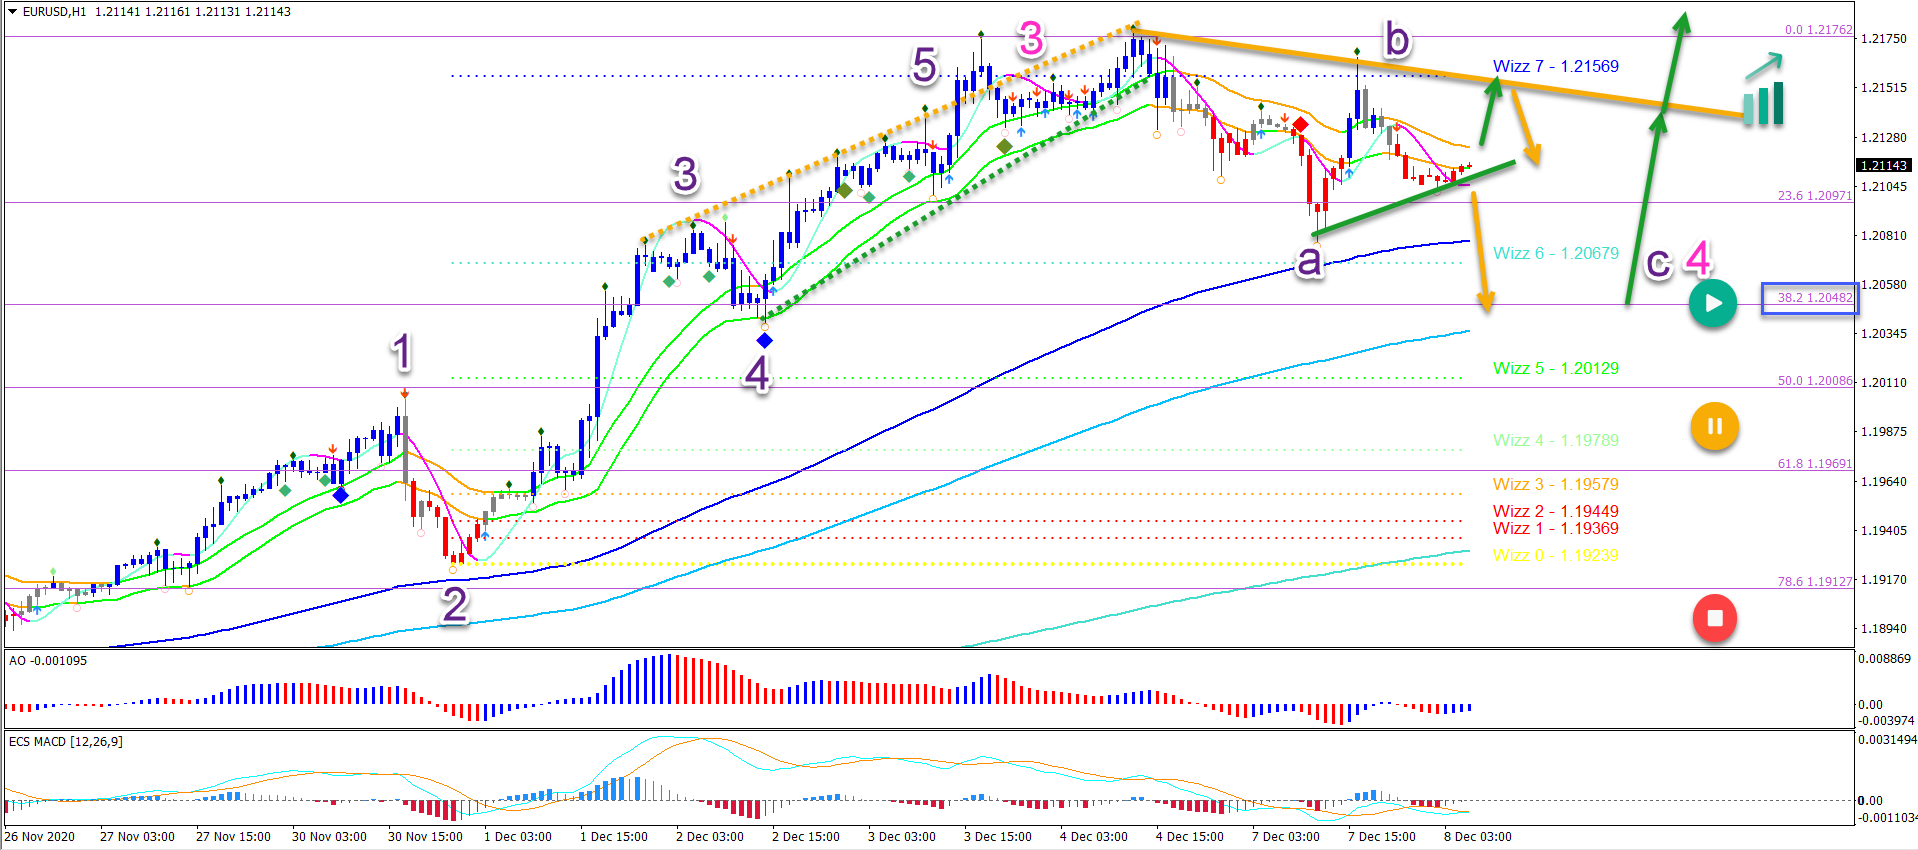
On the 1 hour chart, price action seems to be building an ABC (purple) retracement within the wave 4 (pink). The wave 4 is probably not yet completed.
A break below the support could indicate a wave C (purple) within the wave 4. Another variant is a potential ABCDE triangle pattern or ABC zigzag to the 38.2% Fib.
The analysis has been done with the indicators and template from the SWAT method (simple wave analysis and trading). For more daily technical and wave analysis and updates, sign-up to our newsletter.
Good trading,
Chris Svorcik


Leave a Reply