🔥 EUR/USD Bull Flag Confirms Wave 4 Pattern in Uptrend 🔥

Dear traders,
the EUR/USD is building a bull flag chart pattern. This is an indication that the uptrend is expected to soon continue.
But price action must remain above the critical 1.20 support zone. Otherwise the bulls are losing control.
Of course, today’s price movement will also depend on the news from the European Central Bank expected today 10 December.
Price Charts and Technical Analysis

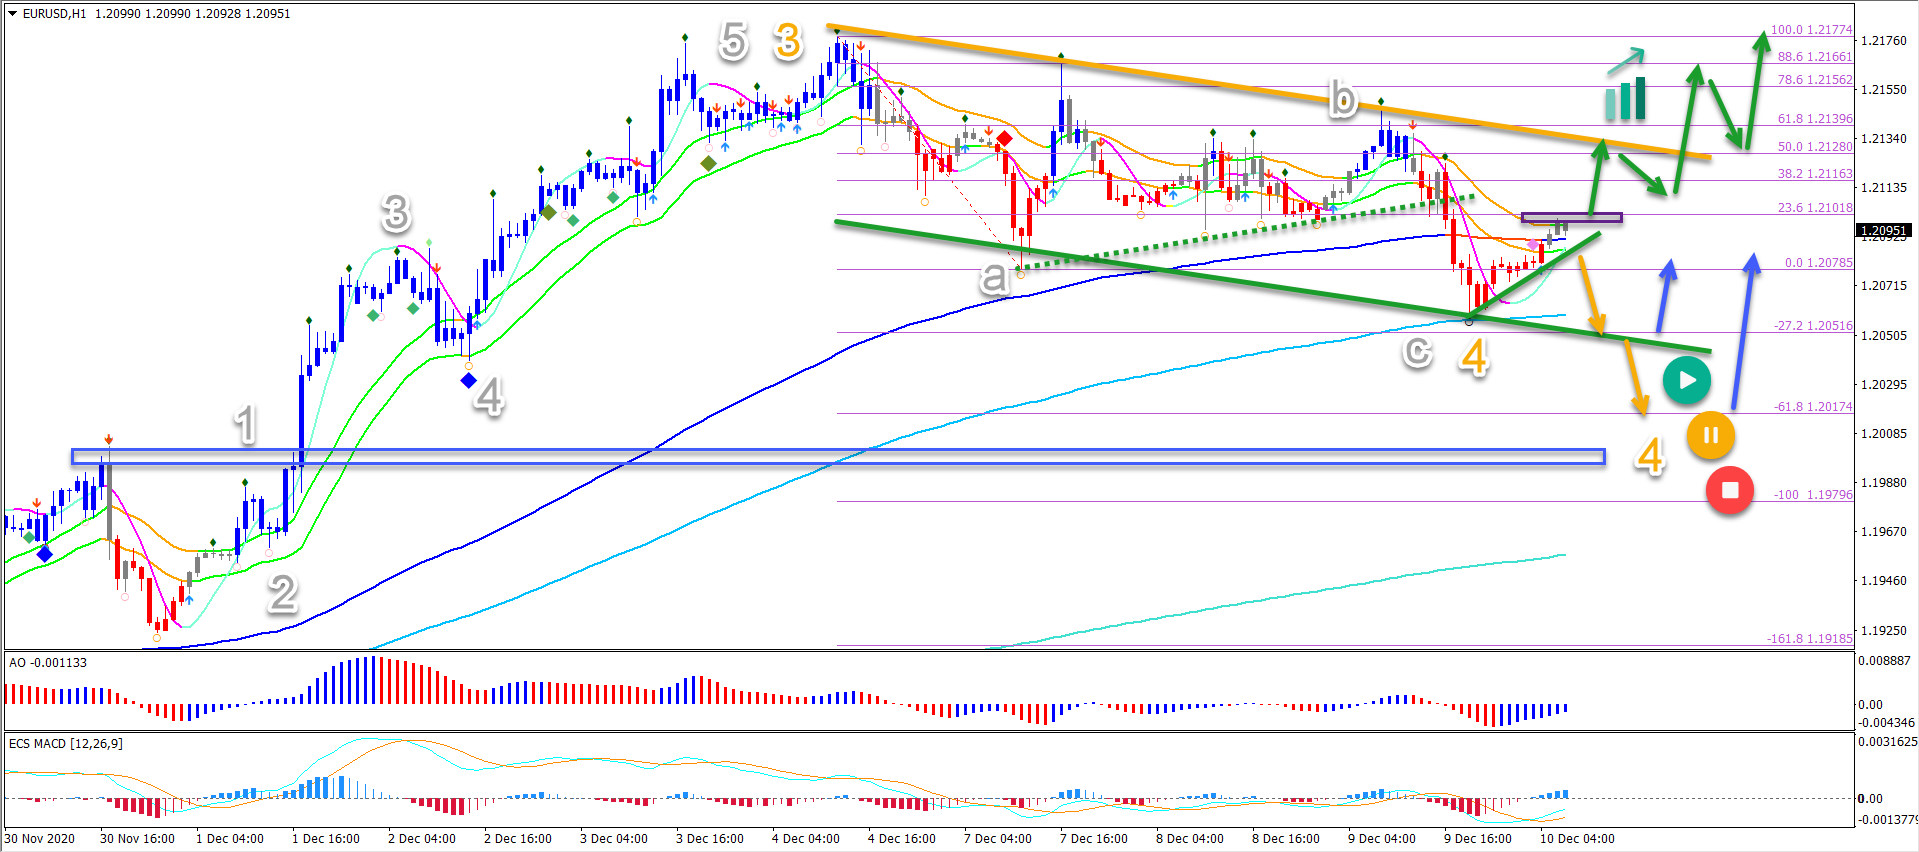
The EUR/USD bull flag pattern is probably part of a wave 4 (orange). The recent strong push higher is typical for a wave 3 (orange).
The wave 4 remains valid as long as price action stays above the 50 – 61.8% Fibonacci retracement and the 1.20 support zone.
Also, a bullish break is a key confirmation of the uptrend. It also confirms the end of wave 4 and the start of wave 5. The main target is the -27.2% Fibonacci target at 1.2250.
On the 1 hour chart, the key decision zone is at the top of the 21 ema (purple box).
- A bullish breakout confirms the uptrend continuation (green arrows).
- A bearish bounce confirms a deeper pullback in wave 4 (orange arrows).
The main targets of the bearish breakout are at the -27.2% Fib at 1.2050 and the -61.8% Fib at 1.2020.
The analysis has been done with the indicators and template from the SWAT method (simple wave analysis and trading). For more daily technical and wave analysis and updates, sign-up to our newsletter.
Good trading,
Chris Svorcik


Leave a Reply