🔥 EUR/USD Breaks Above Magical 1.20 Resistance Zone 🔥


Dear traders,
the EUR/USD has strongly broken above the 1.20 resistance zone. Yesterday’s daily candle was large with a 150 pip size.
But it also closed near to the daily high, which indicates that the bulls remained in control at the end of the day.
This leaves no question marks about the intentions of the EUR/USD to move higher in the short-term. Let’s review.
Price Charts and Technical Analysis
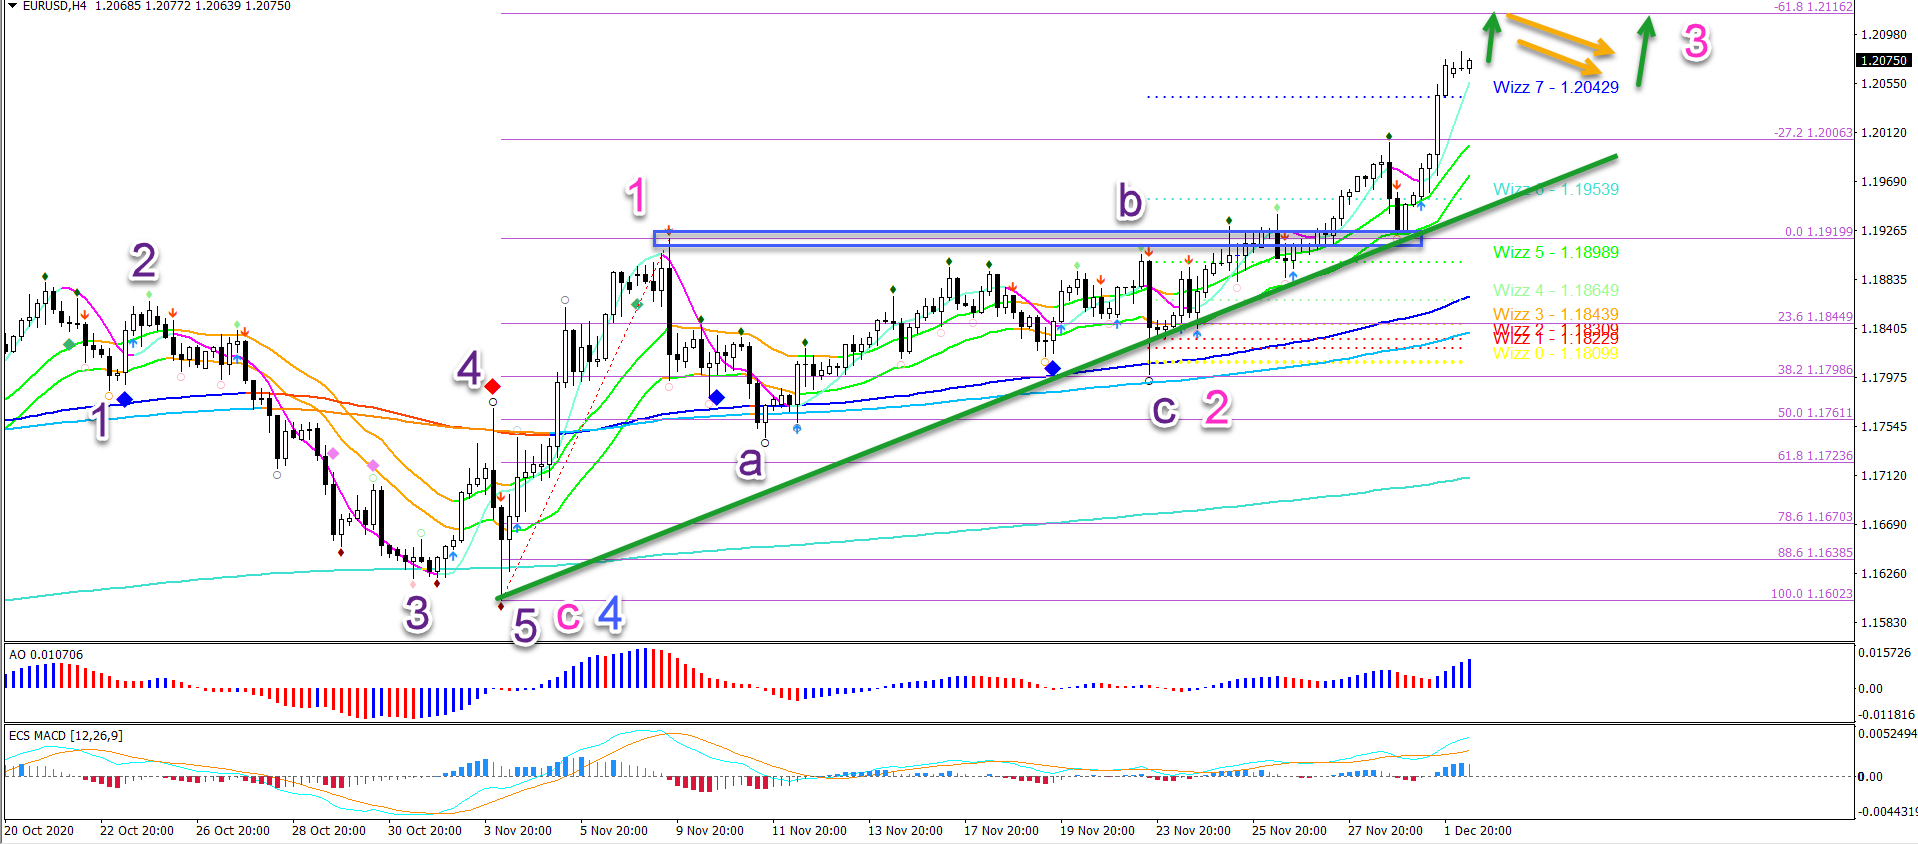
The EUR/USD break above 1.20 was also a push above the -27.2% Fibonacci target. The next Fibonacci target is therefore located at the -61.8% Fibonacci level around 1.2116.
This target zone could create a bull flag chart pattern. If a bull flag pattern does emerge, then that would be a strong confirmation of a wave 3 pattern (pink).
On the 1 hour chart, we see that the bullish breakout above the resistance trend line (dotted orange) as mentioned in yesterday’s analysis did kick start the bullish momentum.
The bullish push up is probably a wave 3 (grey). The wave 3 could still be in motion or already has been completed. This will depend whether price action shows an immediate continuation or makes a retracement back to the 21 ema zone.
The 5 wave pattern (grey) remains valid as long as price action does not enter below the top of wave 1. This would invalidate it (red circle).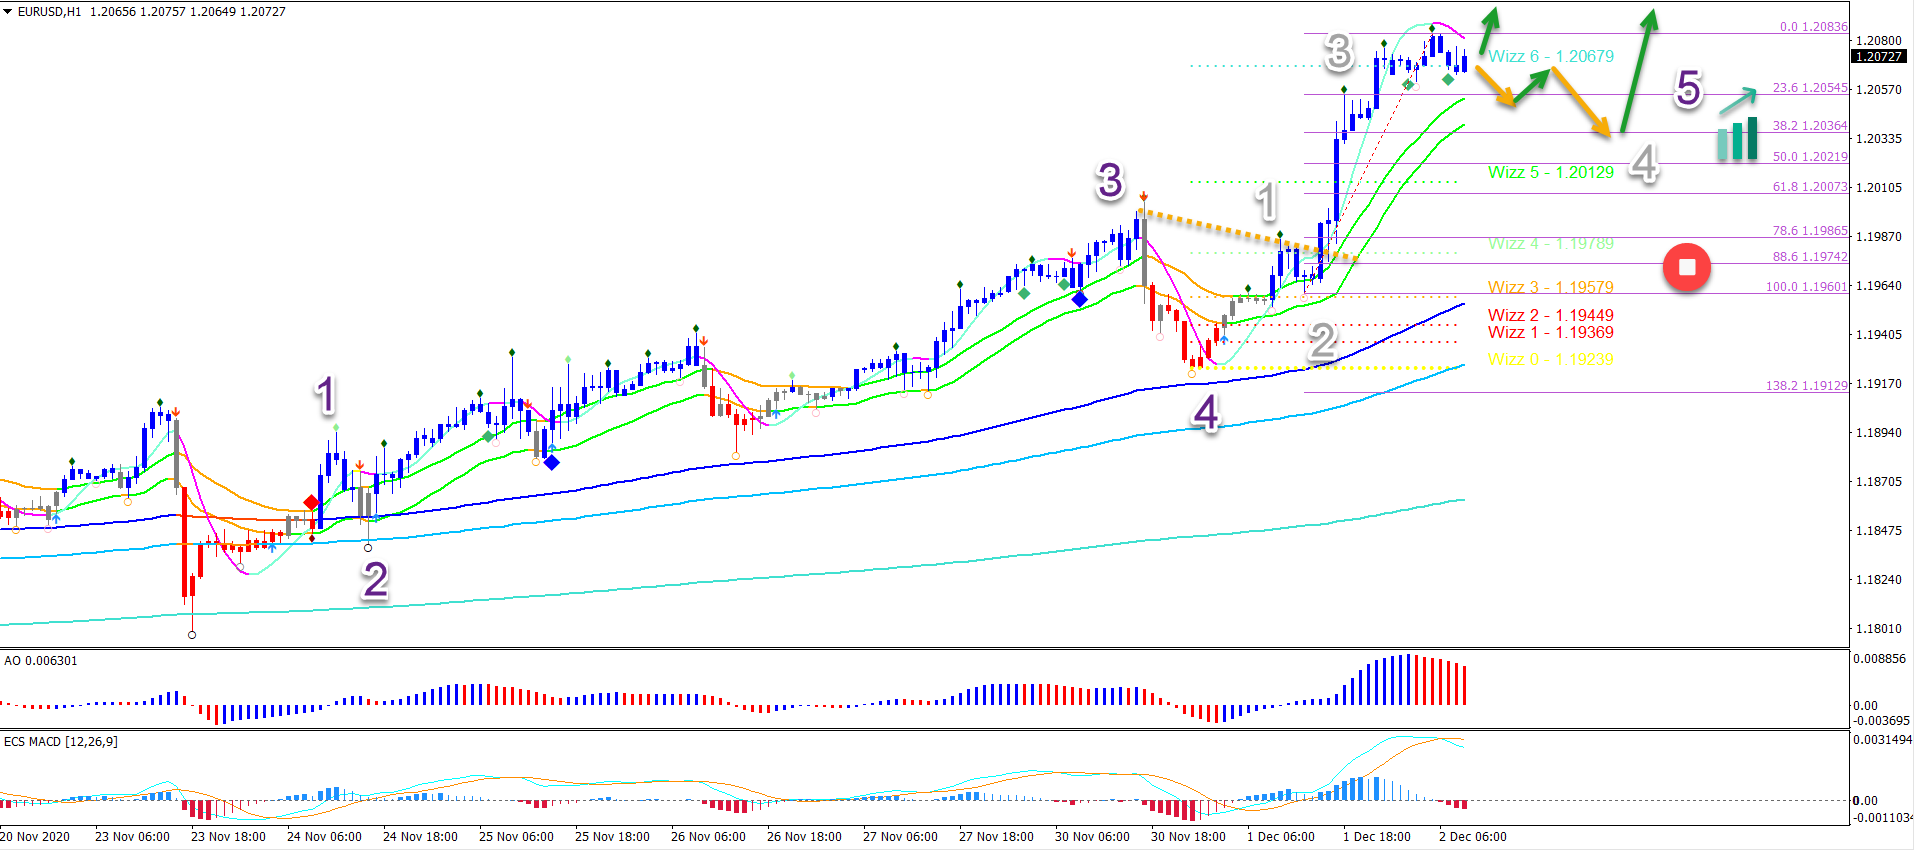
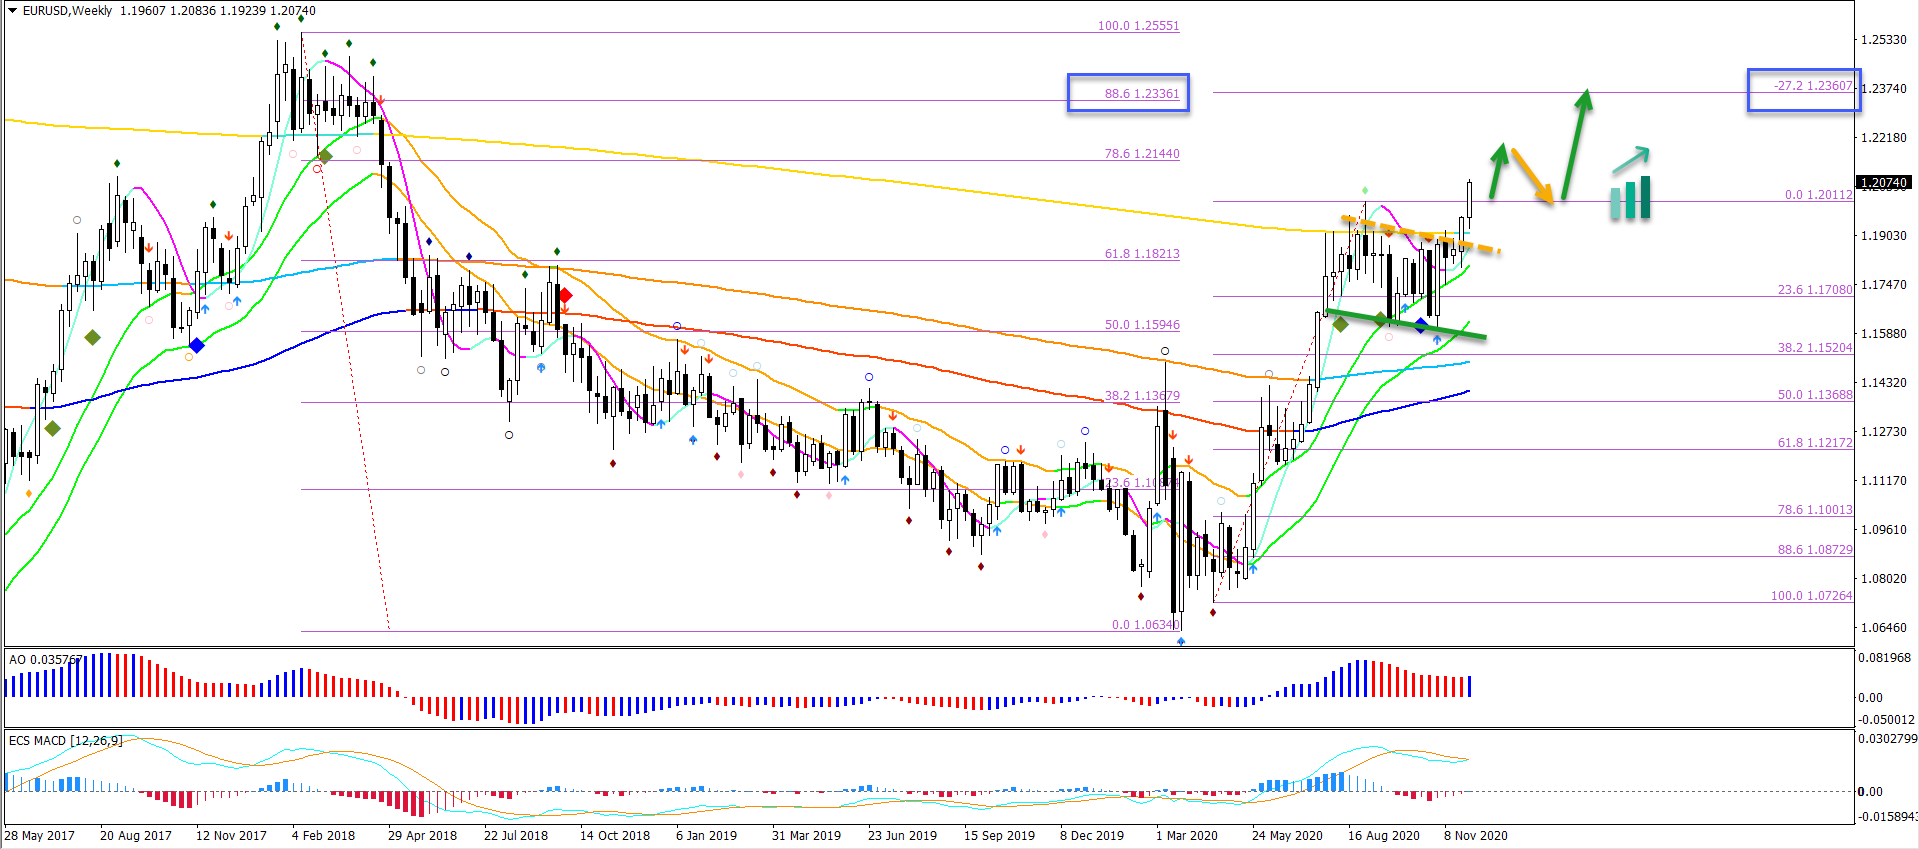
On the weekly chart, we can see that there is plenty of space for the uptrend to move higher. The main target zone is currently the confluence of the -27.2% Fibonacci target and the 88.6% Fibonacci retracement around 1.2350.
The analysis has been done with the indicators and template from the SWAT method (simple wave analysis and trading). For more daily technical and wave analysis and updates, sign-up to our newsletter.
Good trading,
Chris Svorcik


Leave a Reply