☝️ EUR/USD Bears in Control After Rising Wedge Break ☝️


Dear traders,
the EUR/USD rising wedge chart pattern is confirming a bearish reversal or retracement. How long can the bears keep control before the bulls step in?
Price Charts and Technical Analysis
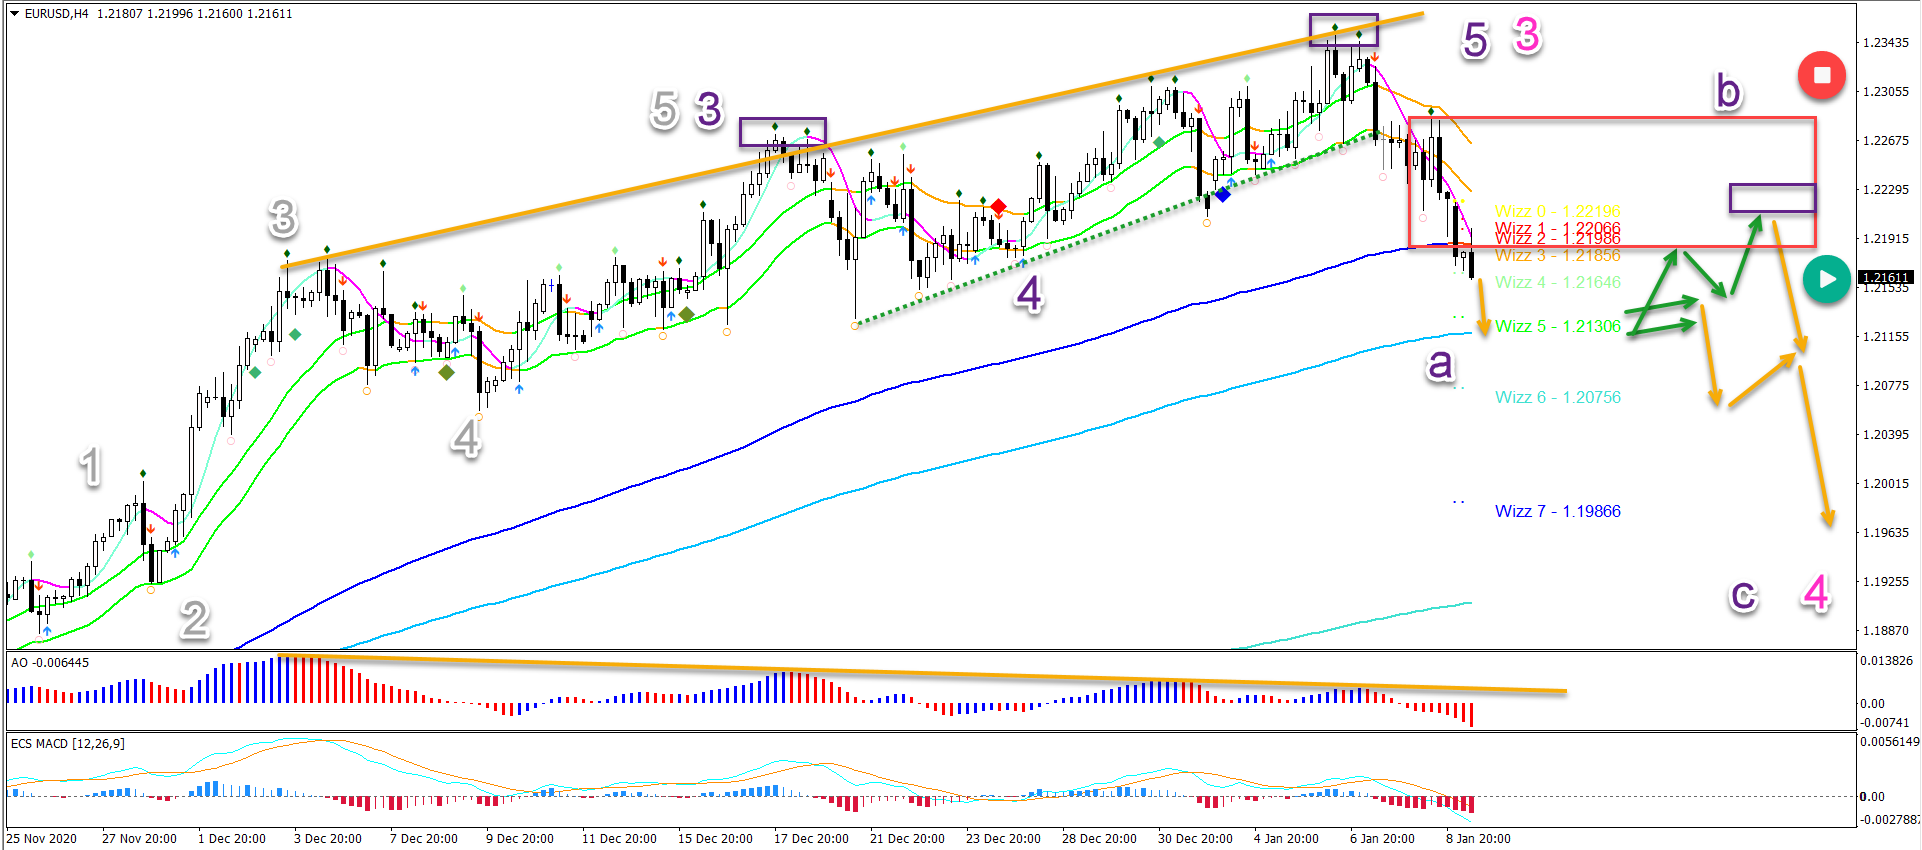
The EUR/USD had several warnings signals indicating the end of the uptrend:
- The double divergence between the tops (orange lines)
- The rising wedge reversal chart pattern
- The break below the wedge and the 21 ema zone zone
- The strong bearish price action after the break in step 3
Price action has in the meantime reached its first target at the 144 ema zone. This could provide support for a bullish bounce, eventually.
But considering the strength of the bearish decline, a fall towards the Wizz 5 target and 233 ema could take place first.
After that, a bullish retracement has the best odds. Either via a bear flag chart pattern or via an ABC retracement back to the resistance zone.
A head and shoulders pattern (purple boxes) could further aid the bears for a move down towards the Wizz 7 target around 1.20.
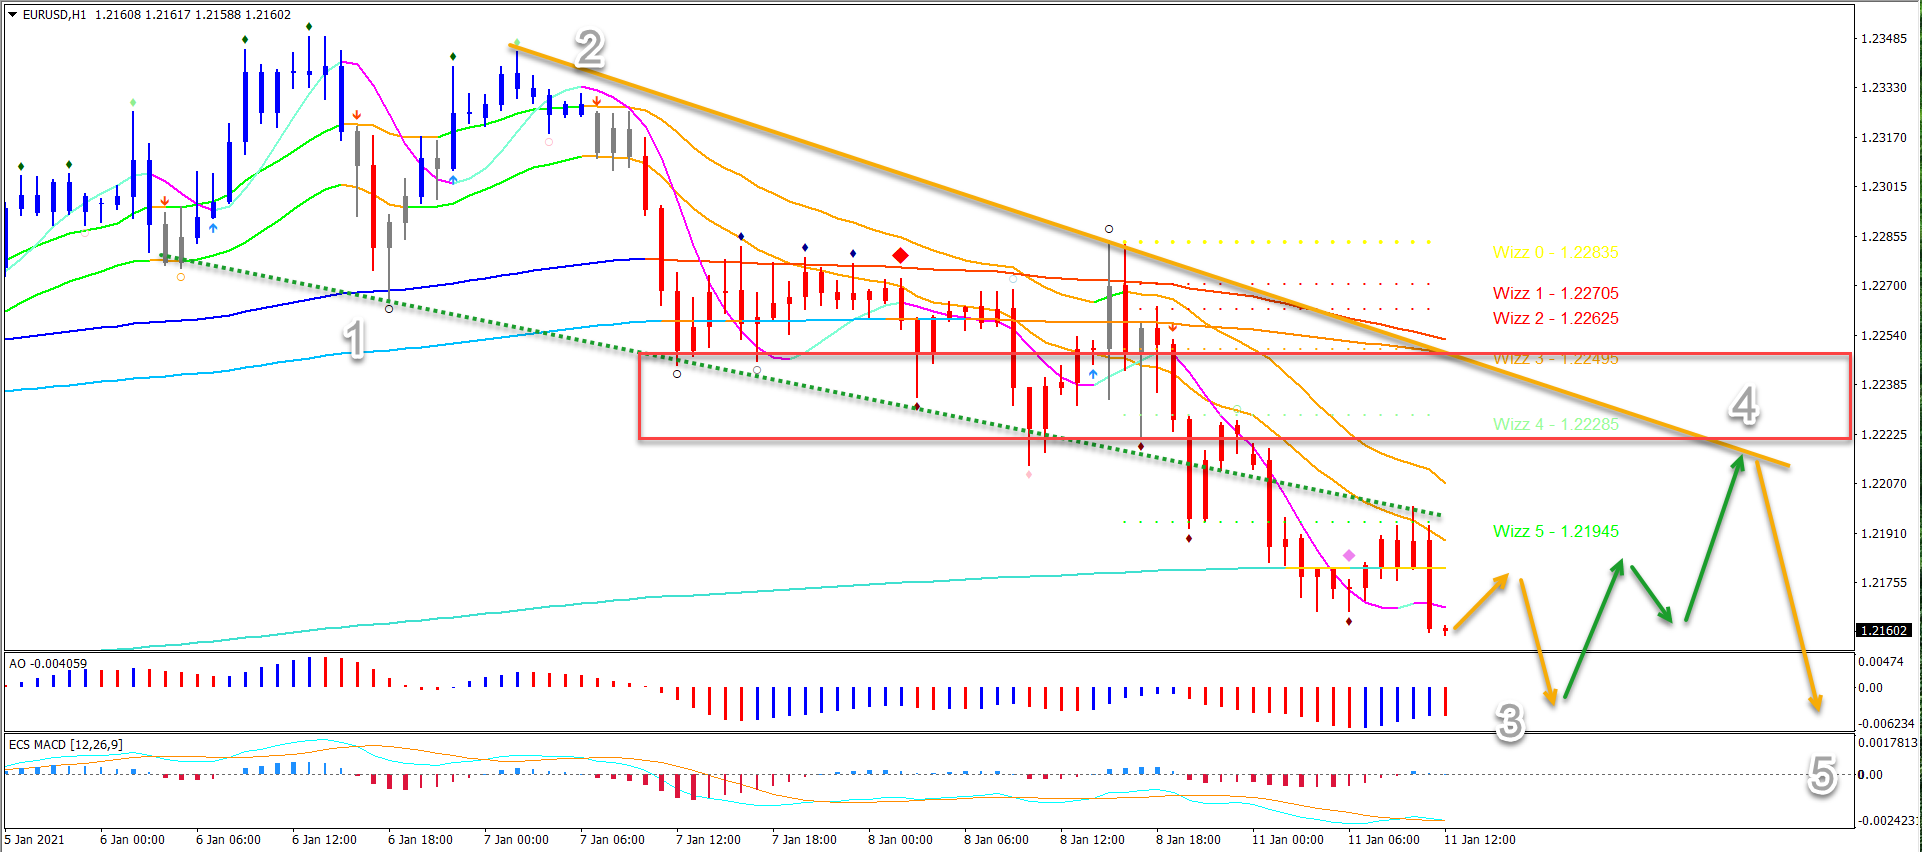
On the 1 hour chart, price action could build a 5 wave pattern (grey). Once the wave 3 is completed, a bullish pullback in wave 4 towards the resistance line (orange) is likely.
After that, we expect a bearish drop for a wave 5 to complete the wave A (purple) on the 4 hour chart.
The analysis has been done with the indicators and template from the SWAT method (simple wave analysis and trading). For more daily technical and wave analysis and updates, sign-up to our newsletter.
Good trading,
Chris Svorcik


Leave a Reply