🎯 EUR/USD Bearish Break Below 1.20 Aims at 1.1750 🎯

Dear traders,
the EUR/USD made a bearish breakout as expected in our Elliott Wave analysis on Tuesday. Price action fell below 1.2050 towards the round psychological support at 1.20. There it made a short bullish bounce before breaking earlier today below 1.20.
This article reviews the main targets for the decline. We also analyse what waves and price swings to expect this week.
Price Charts and Technical Analysis
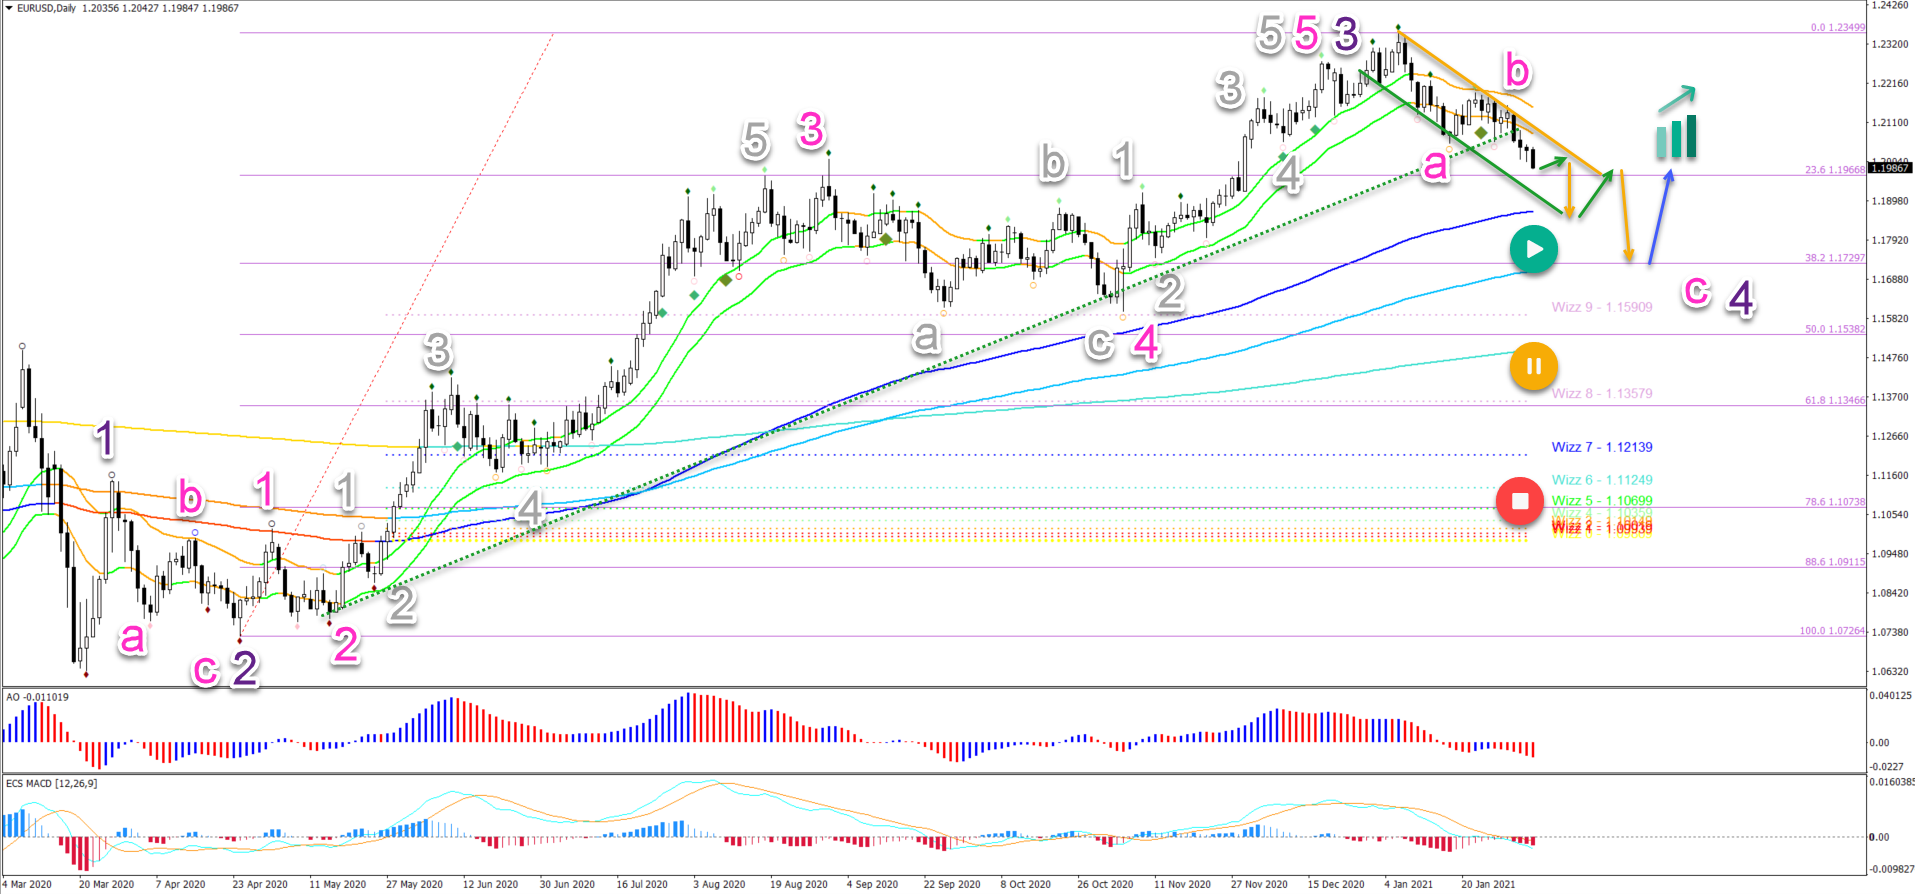
The EUR/USD is building a bearish trend channel. But price action is also approaching the 23.6% Fibonacci retracement level of wave 4 (purple). What can be expected from the waves and Fibs?
- The 23.6% should create a small bounce back up (green arrow).
- But the bullish reaction is expected to be a shallow pullback within the downtrend (orange arrow).
- A strong wave C (pink) should take price action to lower levels.
- The main targets for the bearish wave C are the 144 ema zone and the 38.2% Fibonacci retracement level.
A bullish bounce (blue arrow) is eventually expected at the 38.2% (or 50%) Fibonacci level if the wave 4 (purple) analysis is correct.
- The wave 4 becomes less likely (yellow button) with a break below the 50% Fib.
- The wave 4 is invalidated at the red circle.
- The uptrend is back in play after the retracement finishes and we see a bullish breakout above the downtrend channel.
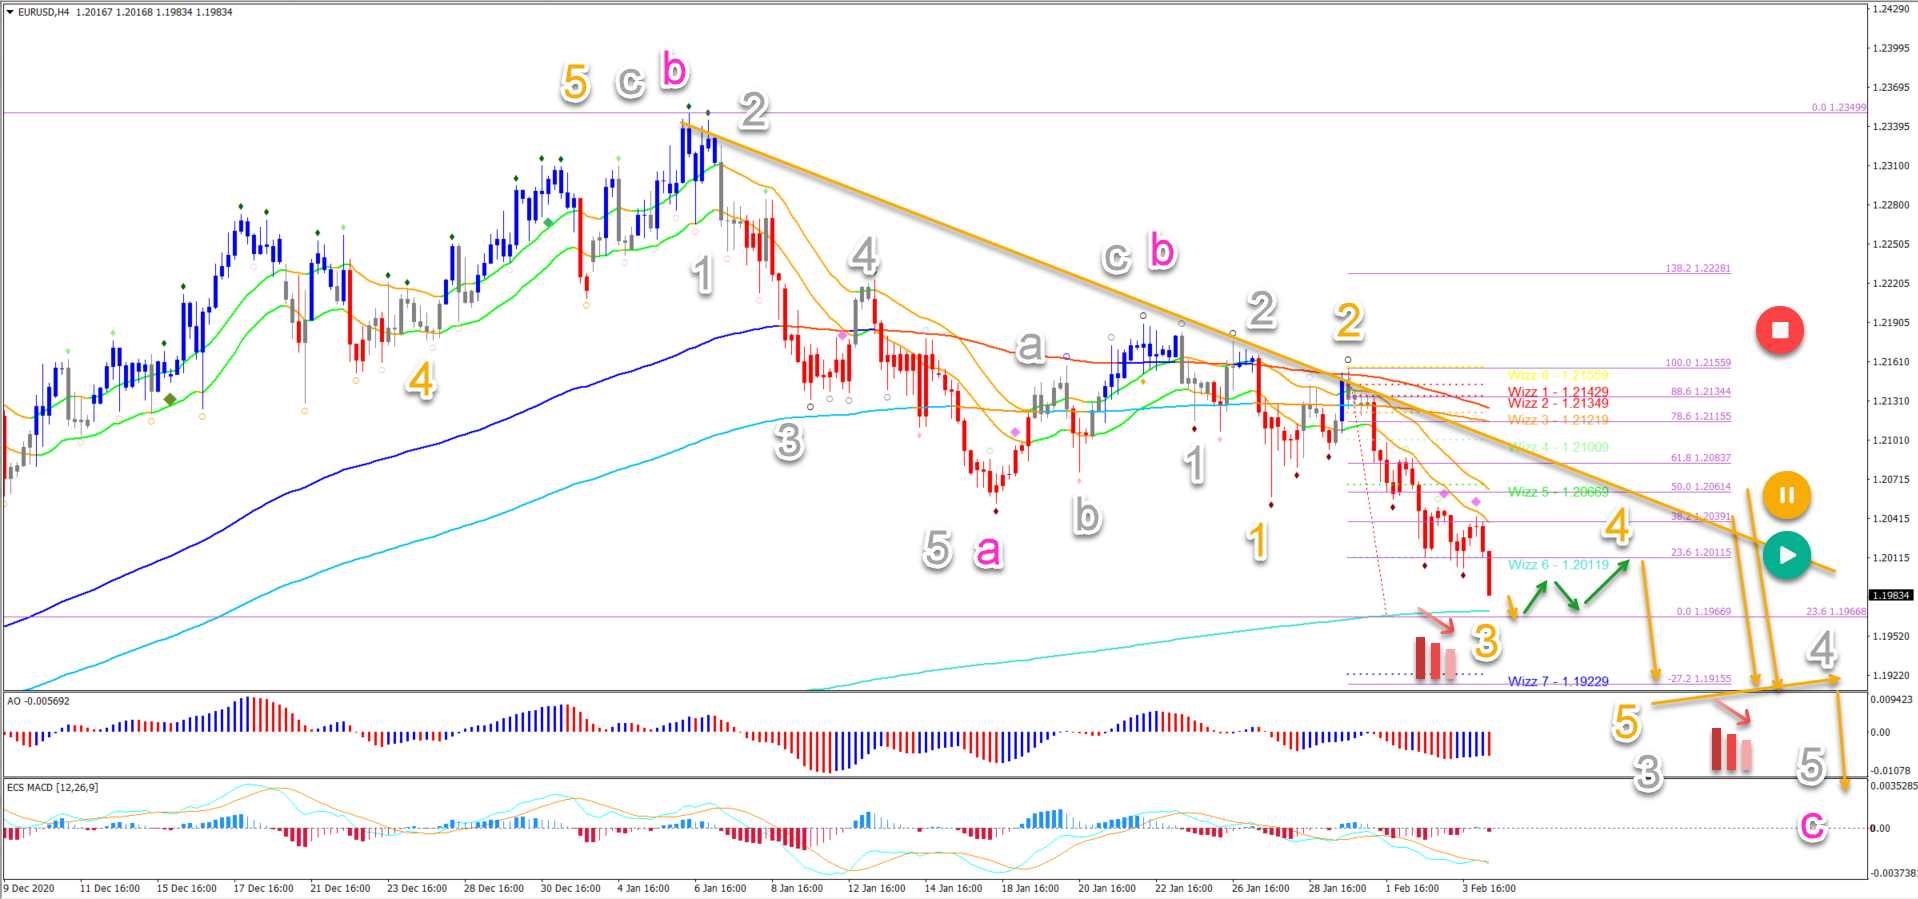
On the 4 hour chart, price action seems to be building 5 waves (grey) within wave C (pink). This seems to fit the ABC zigzag analysis after 5 waves (grey) were completed in wave A (pink).
The current push lower is probably a wave 3 (orange) that could complete at the 23.6% Fib of the daily chart. Then a shallow flag pattern should confirm wave 4 (orange) as long as the pullback remains below the 50% Fib and resistance trend line (orange).
A downtrend continuation is expected to fall towards 1.1915-25. Then even as far as 1.1750-1.18 target zone.
The analysis has been done with the indicators and template from the SWAT method (simple wave analysis and trading). For more daily technical and wave analysis and updates, sign-up to our newsletter.
Good trading,
Chris Svorcik


Leave a Reply