Practical Case Study How to Analyse and Trade Charts


Dear Traders,
Are you curious how to properly analyse the charts with chart and wave patterns?
This article explains step by step how to approach the charts in a practical way, by showing a case study. It dives into one chart and takes the reader through the entire decision making process.
Step by Step Analysis of Charts
For this case study we choose the EUR/USD during July 2018. Depending on your trading style, you might want to figure out what is the long-term direction of the currency pair.
Keep in mind that this is not necessarily needed for traders that take entries on a 4 hour chart or lower but for this example we will provide a full top-down approach which starts with the monthly chart.
By the way, these examples are all based of and explained in our course called SWAT – simple wave analysis and trading.
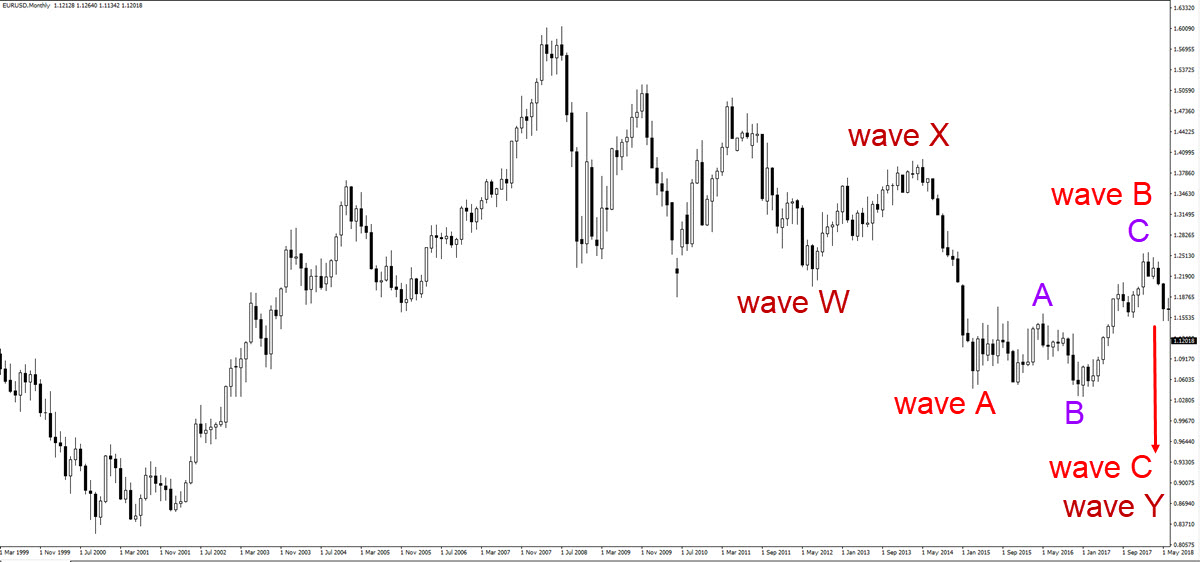
The EUR/USD long-term outlook offers both a bullish and a bearish version when looking at the monthly chart (see image above and below for both variations). In many cases, I only add the wave analysis that seems most probable but it is always fine to keep a few variations in mind – especially if the outlook is unclear. In most cases, I will have a favourite wave outlook but sometimes two or three wave scenarios could be all equally likely.
Although the two wave outlooks differ in the long run, the interesting aspect is that they both indicate the same direction in the near future: downside is expected in both cases because price is either starting a new red wave C (see image above) or price is building a bearish retracement in blue wave B (see image below).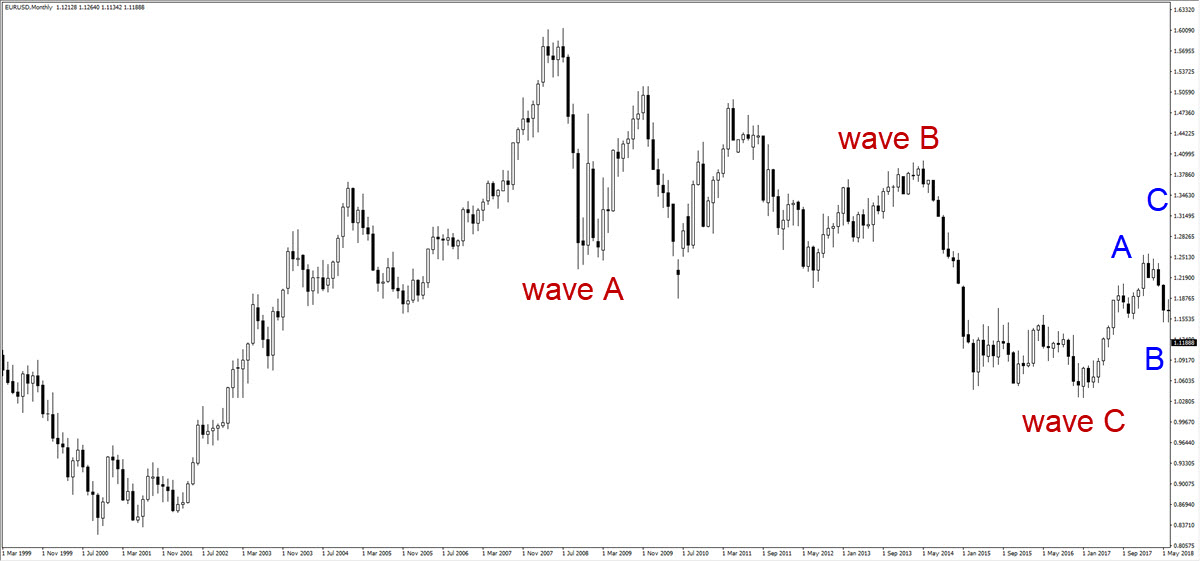
Now let’s take a look at the weekly chart (below). What wave patterns do you see?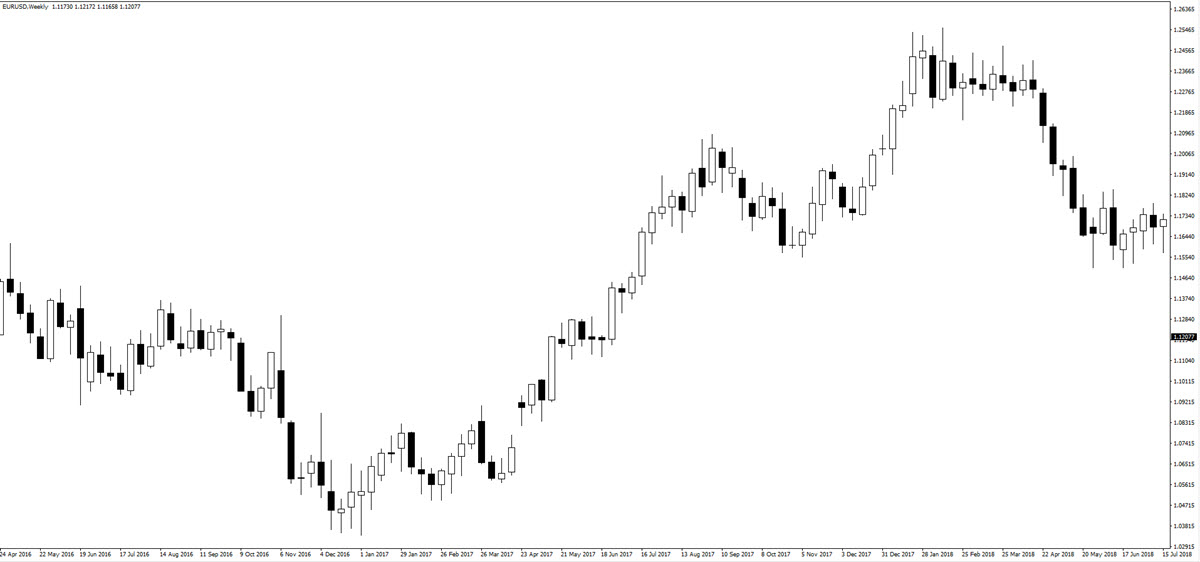
The clearest wave pattern is the 5 bullish waves up (image below). After 5 waves, traders should at least expect an ABC correction but if the 5 bullish waves end a wave C, then a new downtrend is possible too.
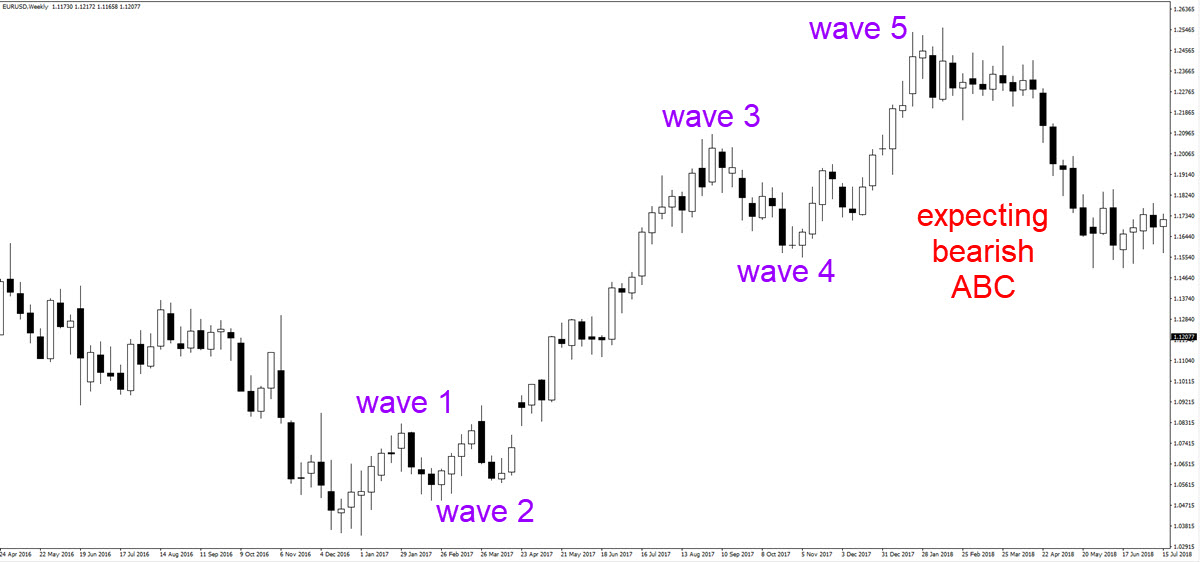
Once again, in both cases, we are expecting the wave patterns to be bearish. The character of how price moves lower will reveal some tips on whether price is building a bearish ABC or a full 5 wave downtrend. Lets now analyse the bearish price action on a daily chart.

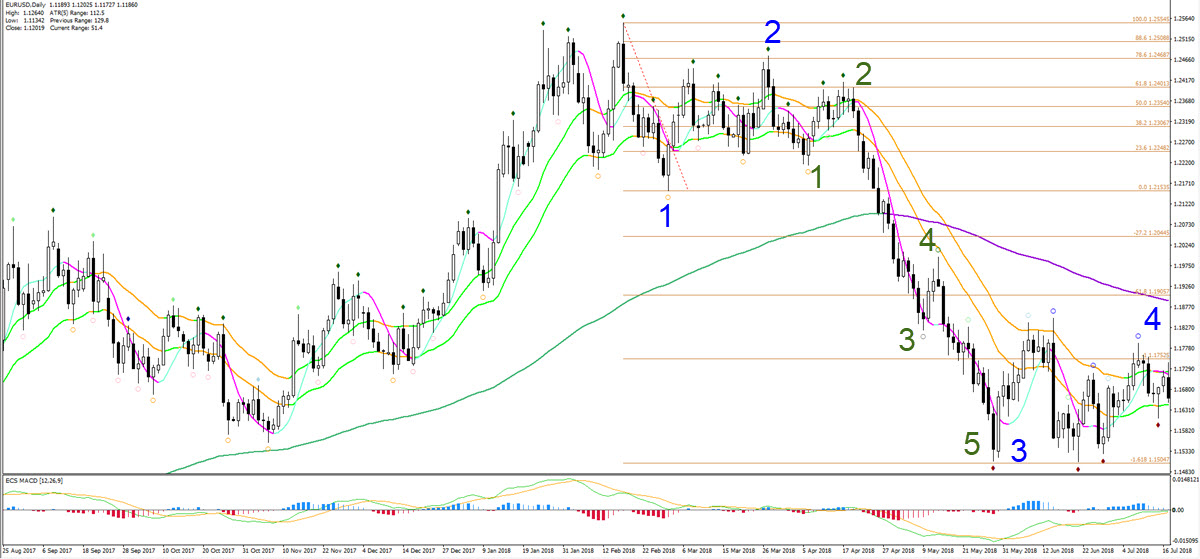
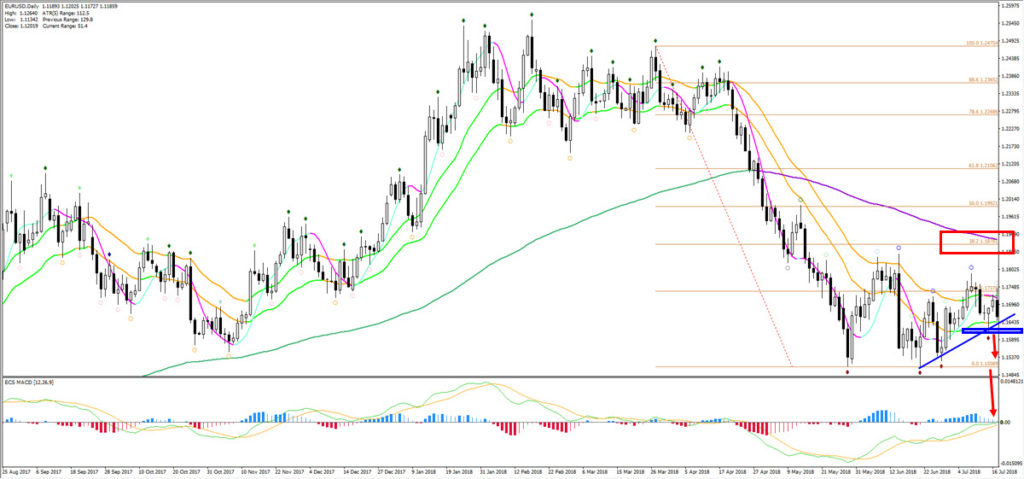
The daily chart ( image above) showed very strong bearish momentum because price was:
- Showing typical impulsive behavior (most candles bearish, closes near the low, continuous lower lows).
- Pulling away from the 21 ema zone for 28 candles (see SWAT method chapter for more info on its importance). This is classical impulsive price action.
What wave pattern matches this particular bearish impulse?
In this case, the bearish momentum is probably a wave 3 and not a wave C because of its large push lower. Here is an overview:
- Fibonacci target: a wave C typically aims at the -27.2%, -61.8%, -100% targets whereas a key characteristic of the wave 3 is that price moves at the very least to the -161.8% target. As you can see in the image below, price made it to the -161.8% Fibonacci target so a wave 3 is very likely.
- Internal waves: there is also a clear 5 wave pattern (green) in the bearish wave 3 (blue).
- Corrective wave: the current price action is looking choppy and corrective, which is typical for a wave 4 pattern.
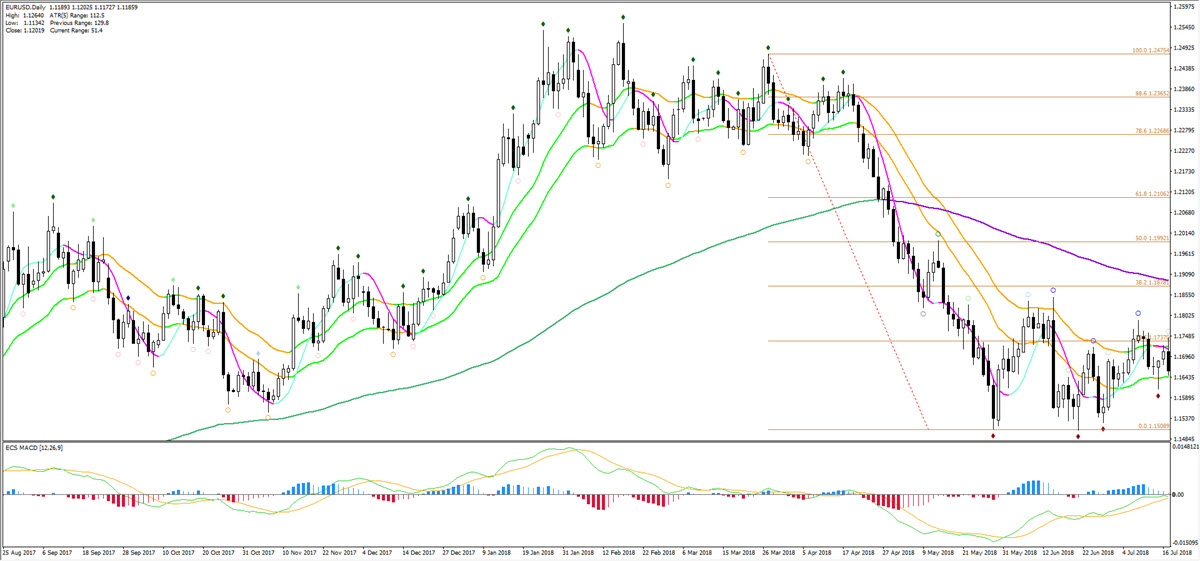
Doing wave analysis is a more complicated technique so traders who prefer to do analysis without wave patterns can simply focus on the fact that:
- A downtrend is visible: the short-term MAs are below the long-term MA.
- The bullish correction is going sideways, which is indicating a retracement in the downtrend and a typical continuation chart pattern.
- The ecs.MACD is indicating a retracement as well.
- Price is respecting the 38.2% Fibonacci retracement level, which is indicating a shallow correction – see image below.
- Lack of divergence patterns indicate that the trend is not running out of steam.
- Lack of bullish reversal chart patterns indicate that the trend is not running out of steam.
So, what do we expect next?
Wave traders: the wave patterns clearly suggest that price will make one more bearish push lower for a potential wave 5 after the wave 4 is completed. An alternative scenario is that price could be expanding the bearish wave 3 but the ecs.MACD has almost fully retraced back to the middle point of the oscillator, so a wave 4-5 outlook is the most likely and favourite scenario.
Non-wave traders: a downtrend continuation is likely since divergence or reversal chart patterns are lacking and price is building a bullish pullback towards the 21 ema zone with the MA’s aligned to the downside (21 ema zone below the 144 ema). So far price has also respected the 21 ema zone as a zone of resistance.
Now it’s time to analyse the bullish correction. When will it end, when will the downtrend continue, and when can we trade it?
On the daily chart traders can clearly see a bullish correction with 3 clear price swings and waves. 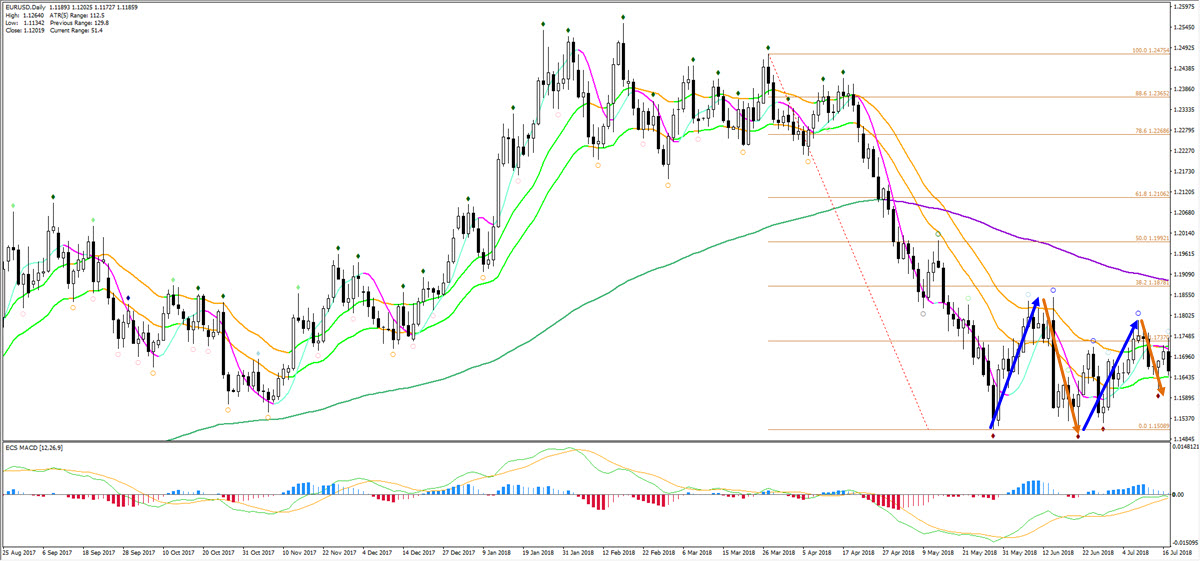
Typical corrective patterns for a wave 4 are flags and triangle chart patterns. The daily chart is looking more like a triangle than a flag pattern due to the lack of a higher high and the presence of a double bottom. Flag patterns on the other hand do have a slight angle, albeit a shallow one. Therefore, traders can conclude that price is likely to be in a contracting triangle chart pattern.
A triangle pattern usually consists of 5 price swings: ABCDE. So far price seems to have made three ABC swings and price could now be in the fourth wave, which is wave D.
For chart pattern traders the same information is valid too and they would analyse triangles in the same way.
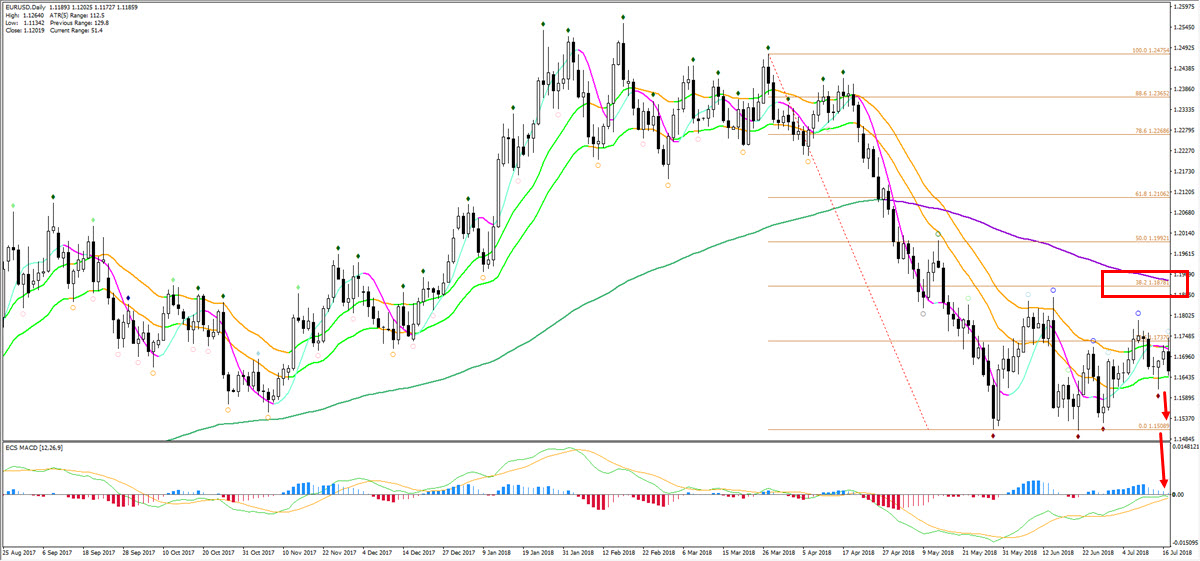
For non-wave traders, the message is simple: traders will be looking for a confirmation that the correction is over:
- Price will either bounce again at the resistance confluence of 38.2% Fibonacci level and the 144 ema.
- Price will make a bearish breakout below the correction for a trend continuation.
Traders can either stop here at the daily chart if you are looking for a swing or position trade setup or zoom into lower time frames if they want to estimate the corrective chart pattern in more detail. Daily chart traders could be looking for:
- A strong bearish daily breakout candlestick below the 21 ema low, support trend line, and support Fractal.
- A bearish daily rejection candlestick at the 38.2% Fibonacci retracement level.
- The second next bearish breakout: the next attempt could be a wave D and hence could bounce at support. The next breakout after that should work better.
However, 1 and 4 hour traders will not stop here and continue their analysis on 4H. Let’s take a look.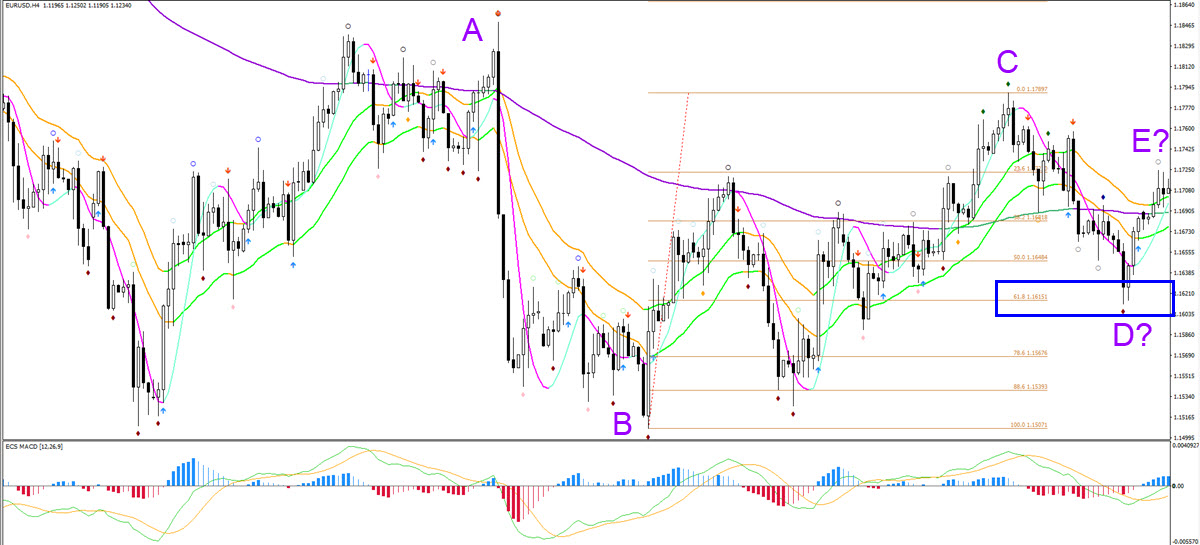
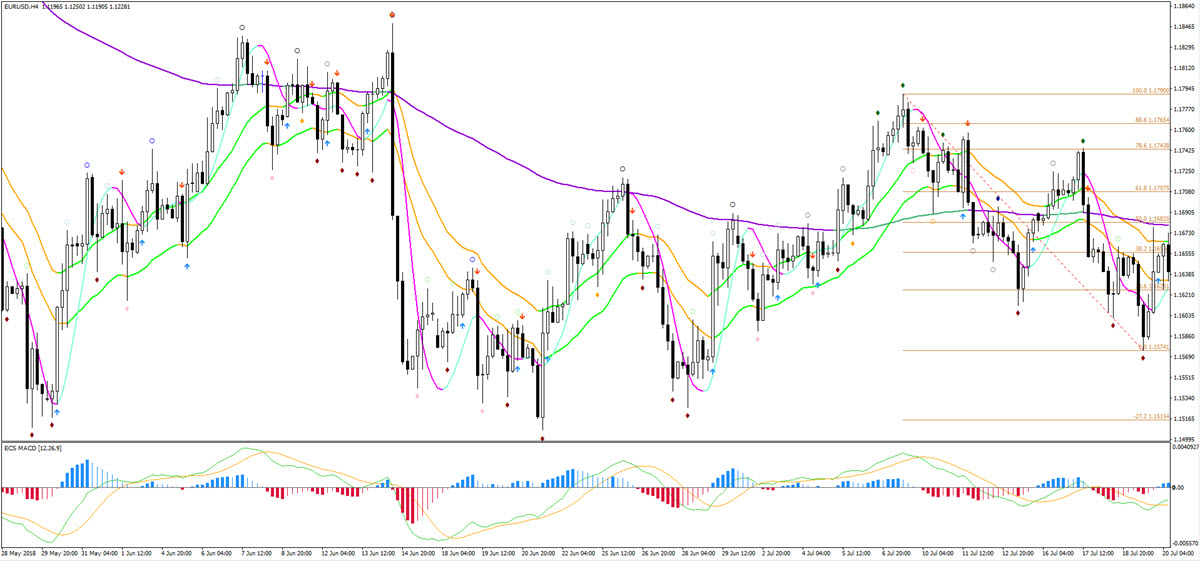
The moving averages are choppy and moving sideways on the 4 hour chart. Price has bounced (blue box image above) at the 61.8% Fibonacci retracement level, which could indicate the end of the wave D… but the wave D is quite short in comparison with the waves A, B, and C. The waves are not expected to be equal in size but there is usually some similarity when looking at the length of each swing in the triangle.
Therefore it could be that price is building three internal swings within wave D and expanding the correction rather than completing a wave E at the moment. In both cases, looking for short setups makes sense but traders should be aware that the downside potential might be limited to the 78.6% Fibonacci retracement level which is where the extended wave D scenario could find support.
Based on this analysis, traders could look for bearish candlesticks patterns as long as the price does not break the top of wave C. Traders could aim for the 78.6% Fibonacci target or wait for a bullish reaction at the 78.6% Fib.
Here is how the chart looks like four days later: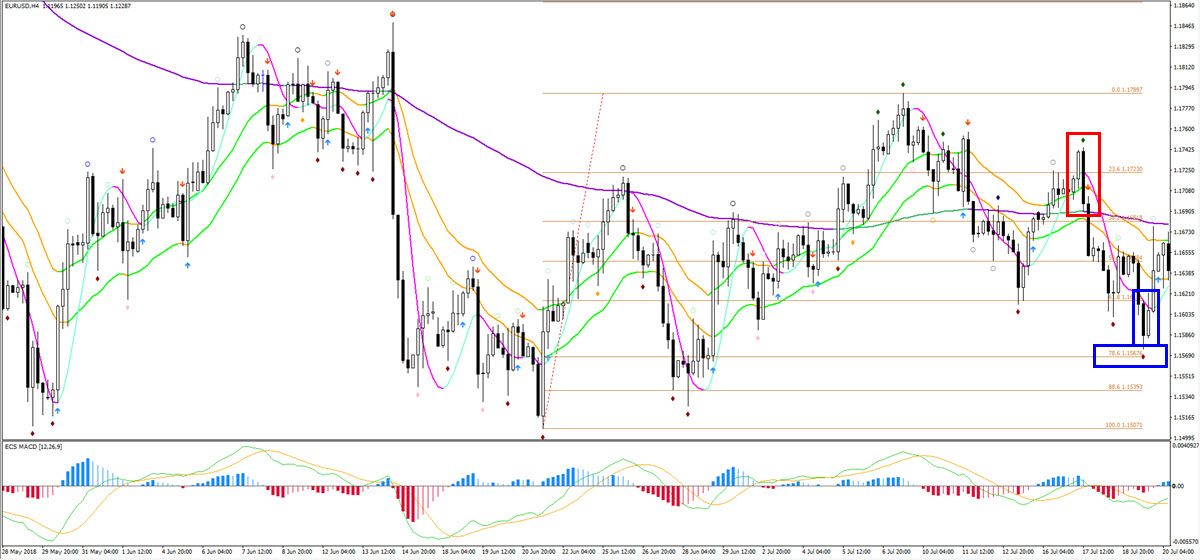
You can see that traders who entered a short setup based on the bearish engulfing twin candlestick pattern (red box) and exited at the bullish candlestick reaction (blue box) to the 78.6% Fib could have earned 90 pips profit (1.1696 to 1.1606) with a 67 pip stop loss (placing it above the pattern at 1.1763) for a reward to risk ratio of 1.34:1 (90:67 pips). 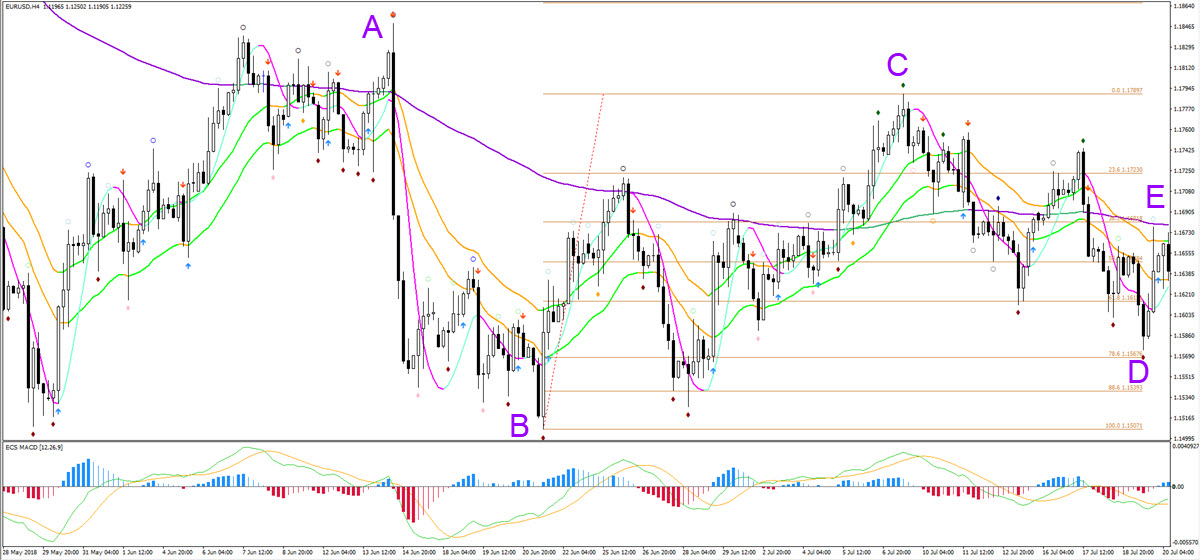
From an analytical point of view, the bullish bounce is indicating that the wave D was probably not finished at the 61.8% Fib. Price has now probably finished the wave D and is moving up as part of the wave E. We can now place the Fibonacci tool on the bearish swing (see image below) and look for bearish reversals and breakouts once the wave E is completed for a full downtrend continuation.
Waves E can be more irregular than other waves. Waves A, B, C, and D typically respect deeper Fib levels whereas Waves E can stop at any spot. Waves E can also vary in length more than other waves.
Two aspects are certain though:
- Price may not break above the top of the wave C (where 100% Fib is placed) otherwise the wave outlook is invalidated.
- A bearish break below the bottom of wave D would confirm the end of the triangle pattern.
The daily chart did not yet offer any short setup for swing or position traders. The breakout candle below the Fractal, 21 ema, and trend line was a doji candlestick pattern, which indicates indecision. The bears lost control as price tried to make a bearish breakout. This candle was not good enough for an entry (see chapter on decision zones and entries).
Back to the 4 hour chart. We are looking for a bearish reversal or breakout to trade the wave E of the wave 4 of the contracting triangle chart pattern. So far the price has only been going up and never managed to break below the 21 ema zone. Price has now reached the 78.6% Fibonacci retracement level, which could be an excellent spot to look for a bearish bounce. Why? 
One advantage is small risk when considering the fact that the invalidation zone is at the wave C top. But the potential reward could be large if traders can hold on to a potential wave 5 trade. The bearish candlestick that appears on the very right of the chart below could be enough for more aggressive reversal traders.
The image below shows how price swiftly moved away from the 78.6% Fibonacci retracement zone with good bearish momentum (red arrow) once a bearish candle indeed closed at that FIb level.
But price failed to break below the 21 zone and went flat (sideways) instead (purple box). A bearish breakout below 21 ema could be a good confirmation that price has completed the wave E at the recent high and that price is ready for a downtrend continuation. 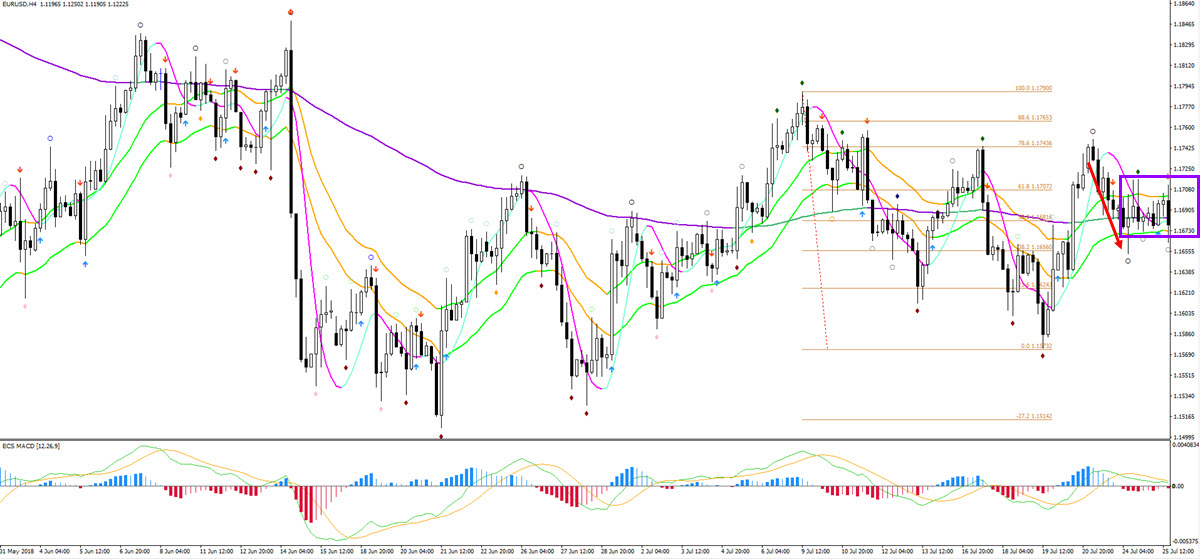
The main question is: will price break soon or will there be a larger bullish correction within wave E? And if price does break, does it break with sufficient bearish momentum? The idea is that if the impulse is not strong enough, then the end of wave 4 might not be ready yet.
As the image below shows, price broke above the 21 ema zone instead and rechallenged the 78.6% Fibonacci retracement and resistance zone where yet another bearish bounce occurred. Two bearish candles clearly confirmed the bounce and reversal and could have provided potential entries for new short setups. The price is now again retesting the 21 ema zone and support trend line and a bearish break below this zone is now even more likely to complete the wave E of the triangle pattern. 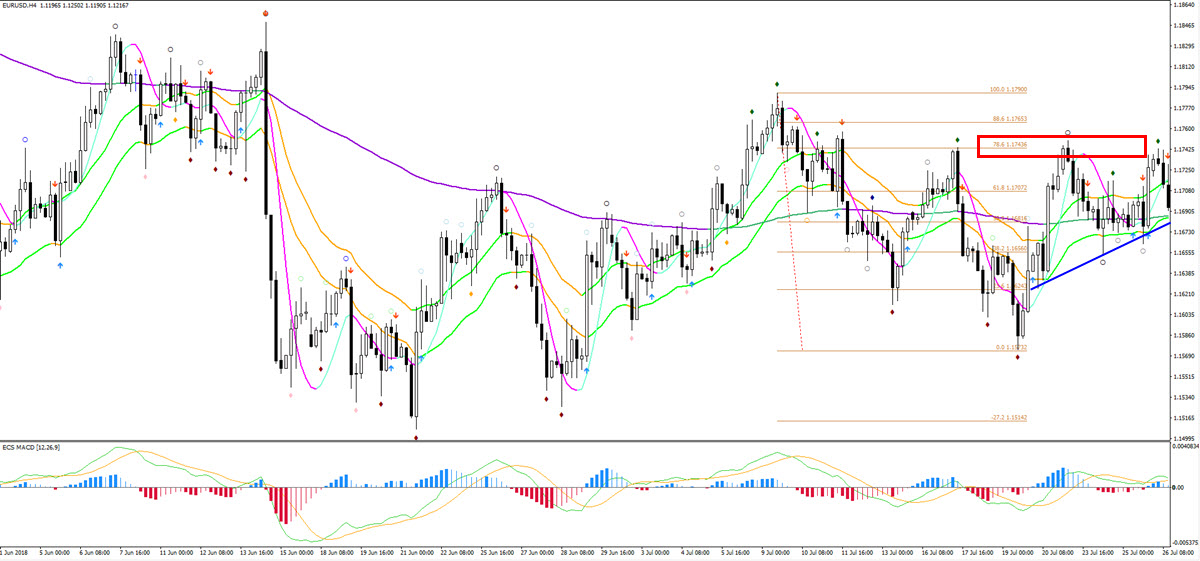
The disadvantage of the image above is that the swat.FRACTALS have turned from red to green, which is indicating more indecision. The MAs are also flat and hence a breakout is vulnerable to a retracement. A trader could take the breakout setup but needs to place the SL at a safe spot, which is above the top and 78.6% Fibonacci level (image below). Alternatively, traders can wait for the pullback after the breakout before trading it.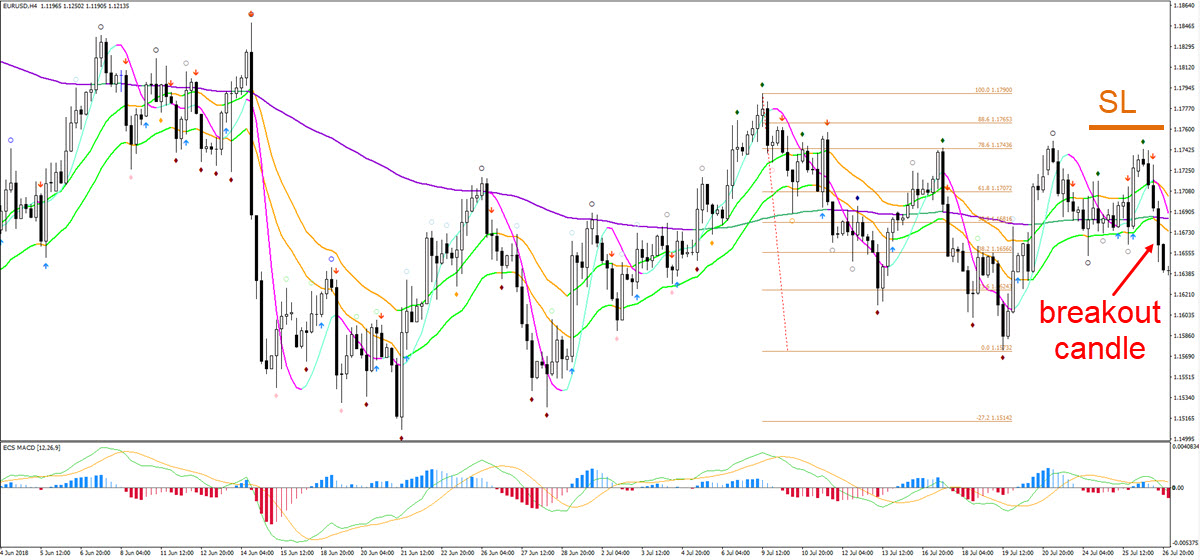
As the image shows (above), finally price manages to break below the 21 ema zone. The breakout candle has some wick at the bottom of the candle, which accounts for 30% of the total candle. The 30% mark is right on the edge of being an OK or weak breakout. It could be enough to consider for a short setup but remains a discretionary call where a trader’s risk appetite comes into play. Another factor could be how much a trader likes this particular setup. The alternative approach is to wait for a potential pullback OR flag pattern. Especially a flag pattern indicates a corrective sideways price movement where the bears keep control.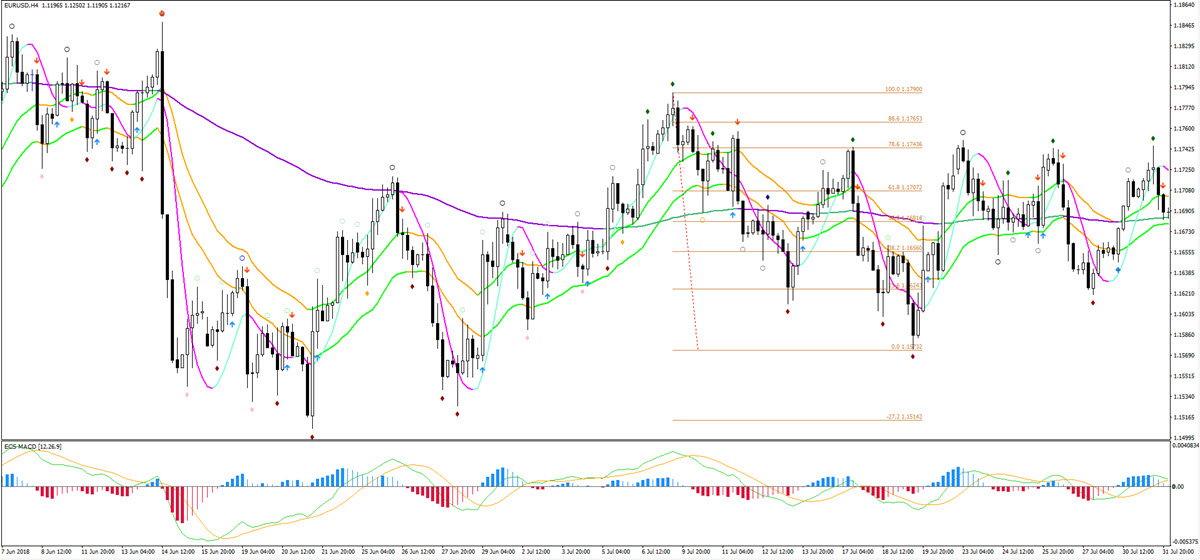
After the breakout price did continue lower for a few candles but eventually started an impulsive move up again which eventually broke above the 21 ema. A bear flag chart pattern certainly did not materialize. The bullish impulse however was again rejected by the same resistance zone (orange box below) and price is again approaching the 21 ema zone (see image below). Sometimes traders need to be patient before a trade setup develops as anticipated and this is a classical example where the market is testing the nevers and patience of a trader. But the good news is that the triple top is likely to confirm the end of the wave E.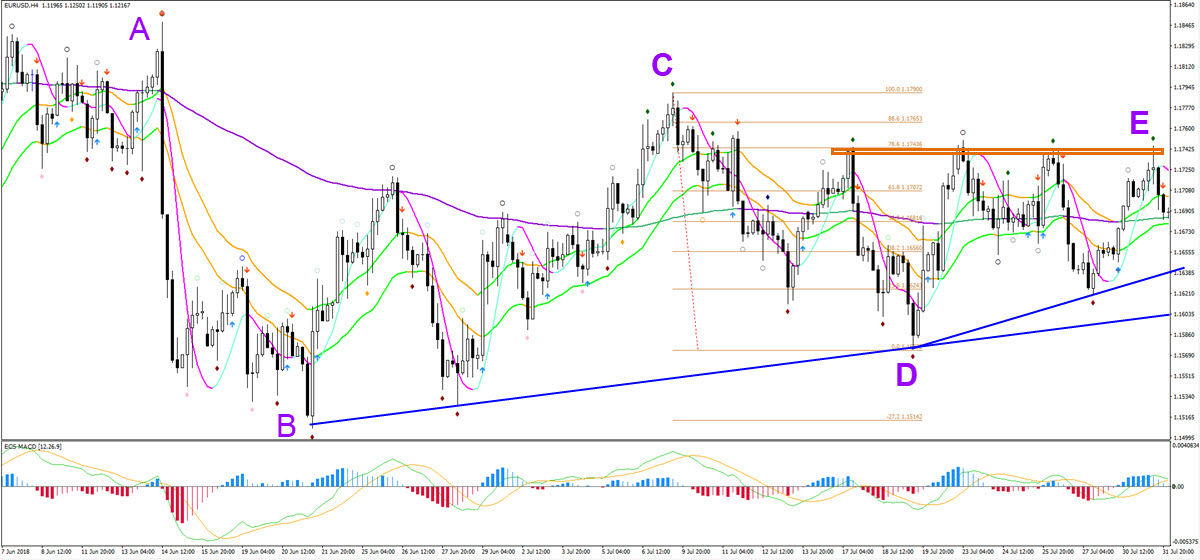
The wave E seems to be quite a lengthy wave by now and it is becoming more likely that a bearish breakout will actually lead to the end of that wave E and the start of the wave 5 and the downtrend. The advantage of a bearish breakout now is that the swat.FRACTALS are again dark red (see the most recent low – the green Fractal is not relevant as we are not looking for an uptrend).
The next chart (below) shows that price has broken again below the 21 ema zone. This is the second breakout, which on average offers substantially better odds of success than the first break. The stop loss could either be at the previous top (conservative) or even at the most recent Fractal (aggressive) if traders trust that the breakout will start a downtrend.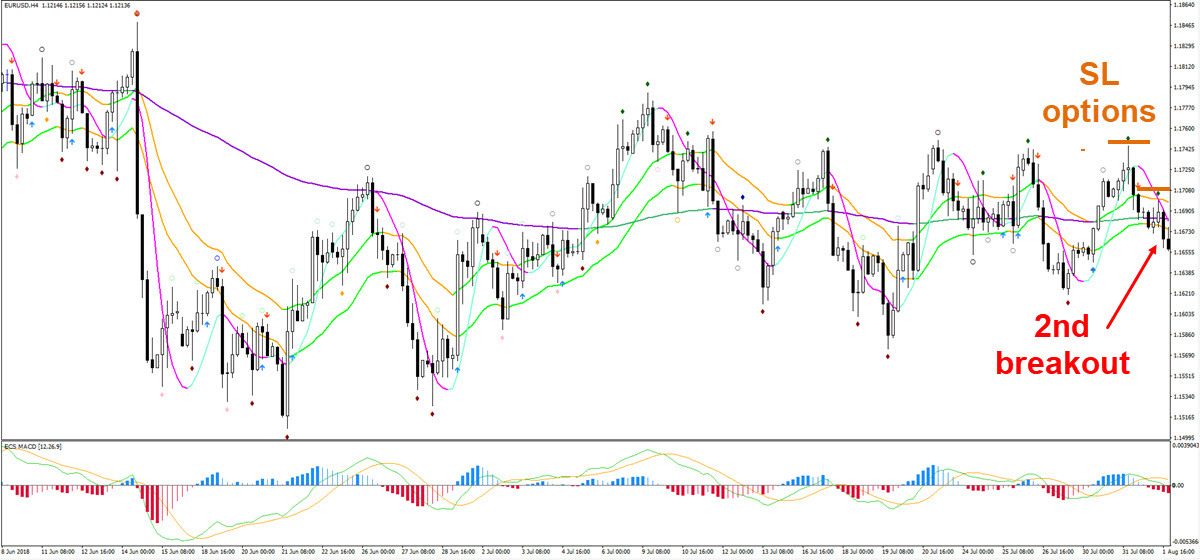
Traders who are waiting for a daily candle to confirm the breakout are not disappointed when they see breakout candle (red arrow below) push and break below the 21 ema zone, the support trend line, and support Fractal. Here the stop loss (orange boxes) could be above the candle high (due to the strong breakout candle) or above the entire top.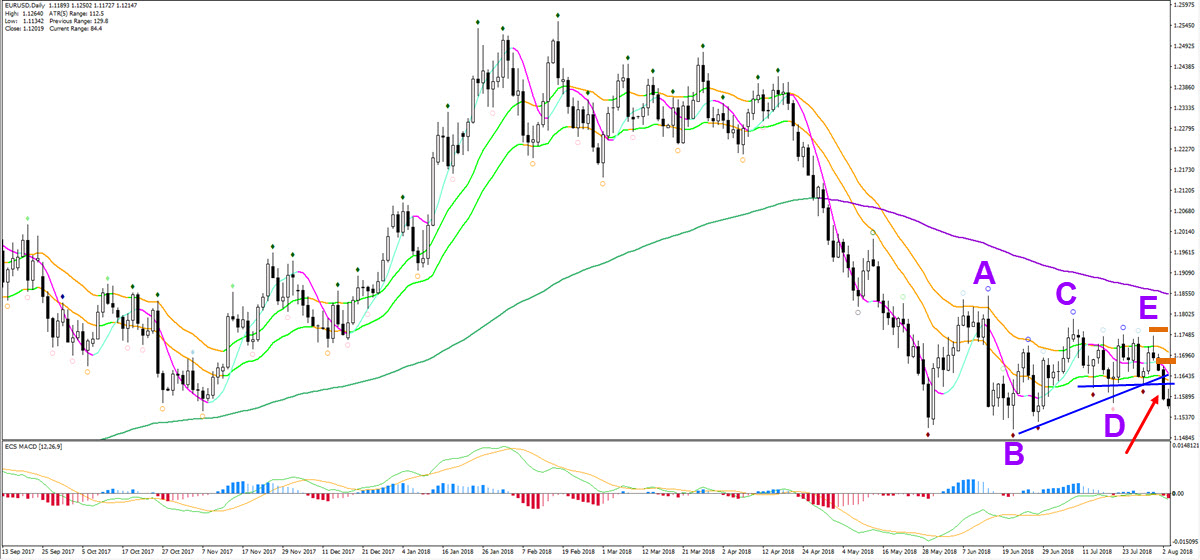
The breakout trade is now indeed well on its way (image below) as price shows strong bearish momentum (blue arrow below). Price fell very quickly, which is exactly what we have been anticipating and waiting for. Any trades taken at the reversal zone of the Fibs or upon the breakout of the MAs is now doing very well. Considering the fact that price is showing strong momentum, it could be wise to keep the trade open and just move the stop loss to break-even. That helps remove the risk but allows traders to aim for larger profits. Let’s now continue our analysis.
Price is moving away from the 21 ema with rapid speed and about 20 candles do not hit the 21 ema zone. Eventually price makes a retracement to the 21 ema zone but due to the strong bearish momentum, the 21 ema zone is expected to act as resistance zone for a bearish bounce and downtrend continuation. Traders could look for continuation trade setups once price breaks below the support lines, swat.FRACTAL, and 21 ema zone (blue box below).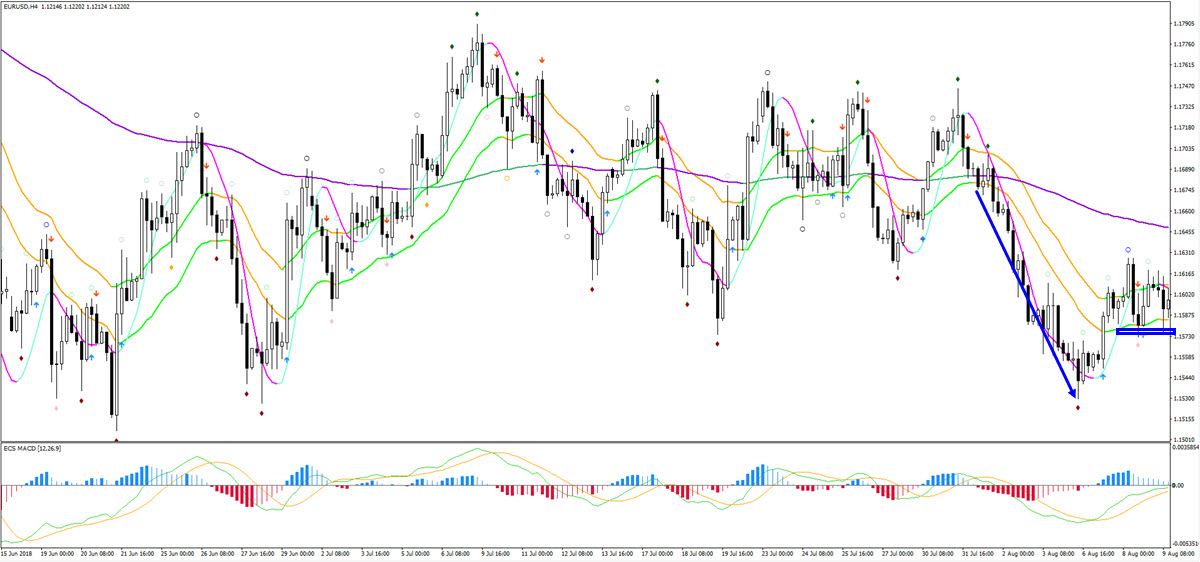
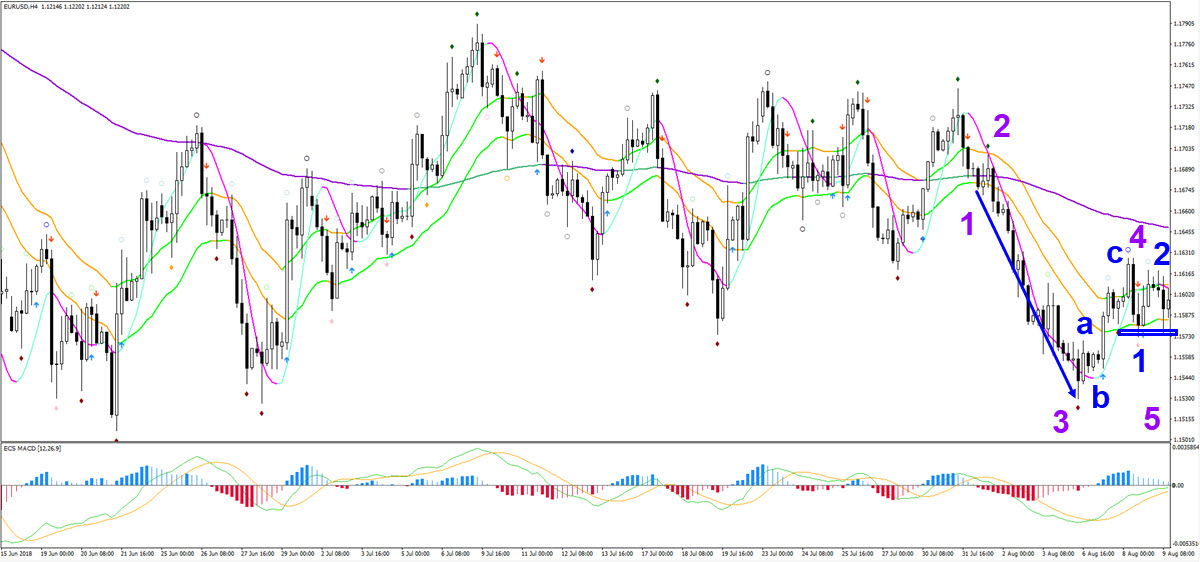
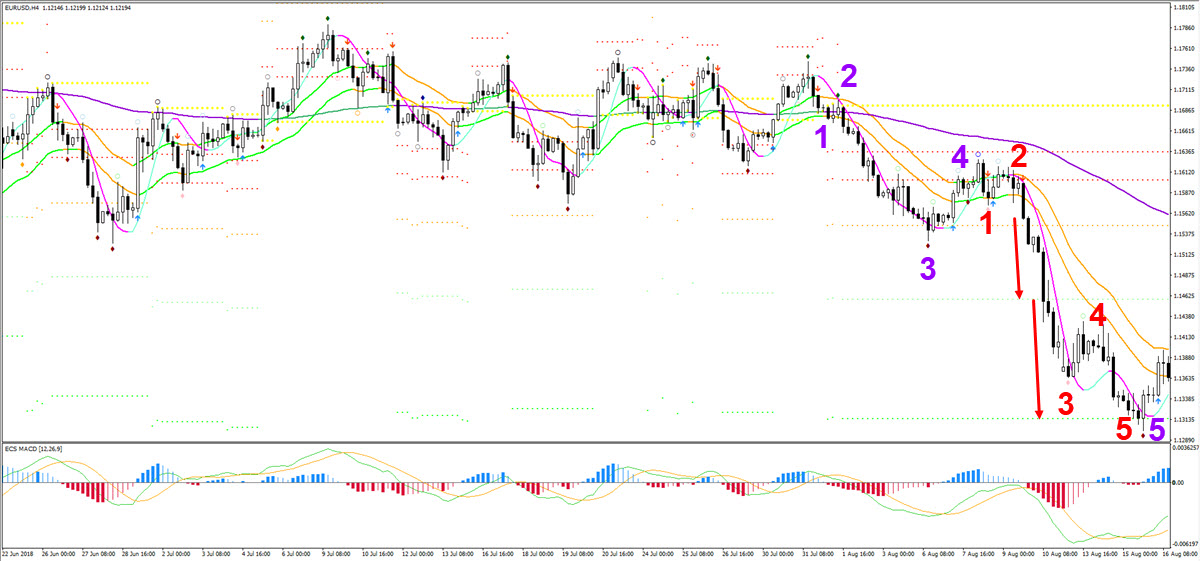
From a wave perspective it seems likely that price has completed a wave 3 (purple image below) and the price is now building a bullish pullback within wave 4 (purple image below).
Other technicals remain very bearish too:
- The moving averages are bearishly aligned with the 21 ema zone below the 144 ema.
- There is also an increasing space between the 21 and 144 ema indicating strong bearish impulse.
- Price has not managed to fully break away from the 21 ema, where bullish candles are fully above the 21 ema zone (not hitting the MAs at all).
- The ecs.MACD has retraced back to the middle point after a strong push to the downside.
- Lack of divergence between the recent bottoms indicate that the downtrend remains strong.
Furthermore, the price seems to be making a bearish bounce at the 50% Fibonacci retracement level (rex box below) which is a typical resistance zone for a wave 4 (image below).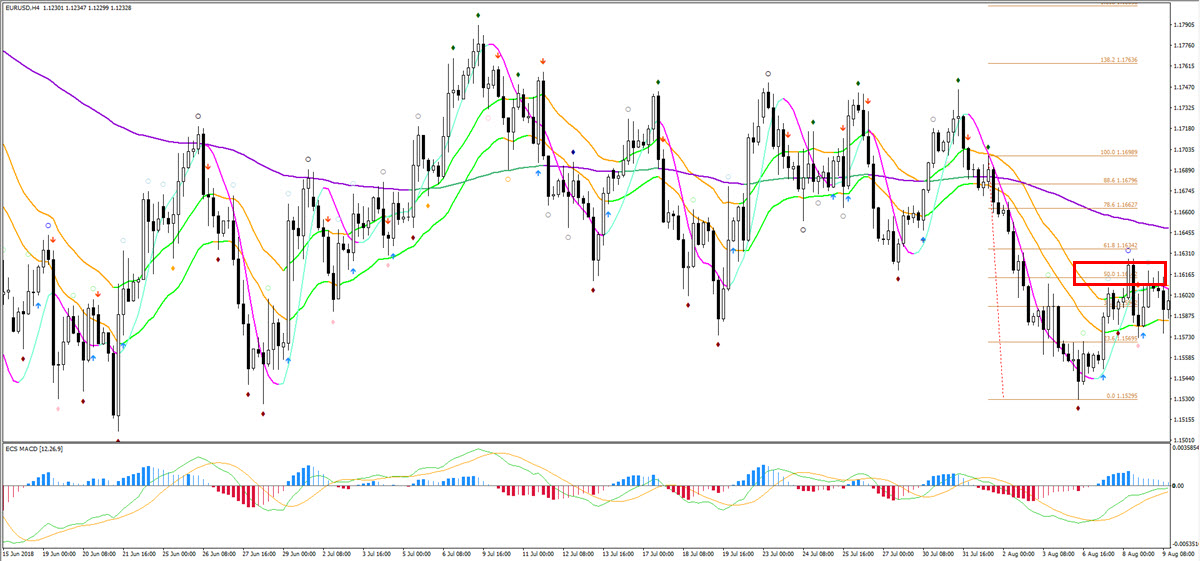
The next candle indeed provides a strong breakout candle (red arrow in the image below) and a bearish continuation after this bullish pullback is now likely. This is the confirmation that the pullback has ended and that price is back on its way down.
Traders could add an additional trade at the close of the breakout candle with stop losses at the orange line. Traders can also move the trail stop loss of their first setups to the recent highs just before the breakout to lock-in some profits on the first setups.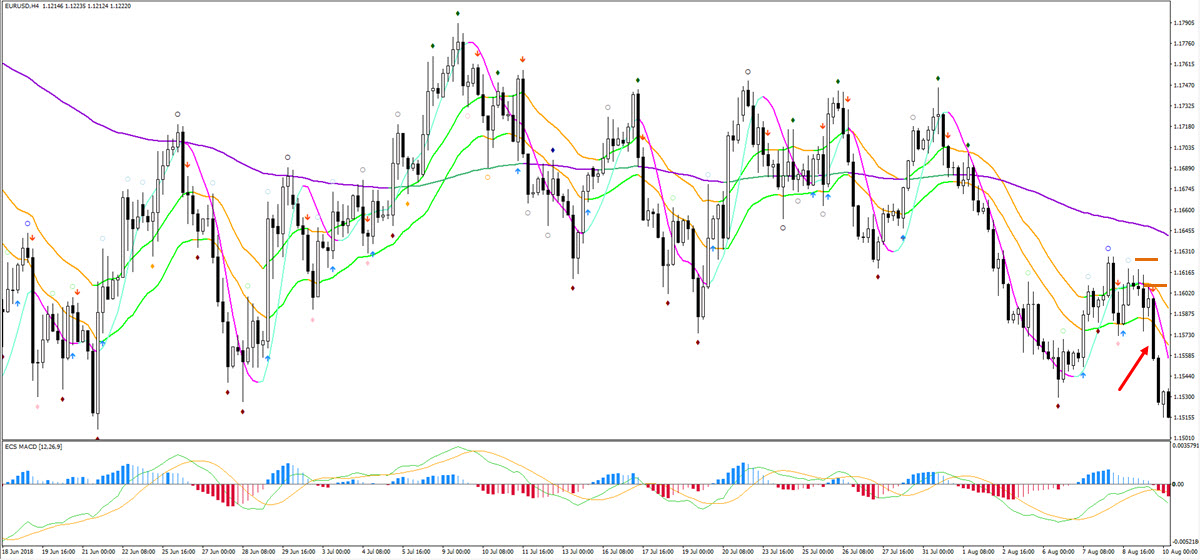
So far the trend has been strong, the pullback has been shallow, and the continuation breakout looks good. The next question is: how far can price push lower?
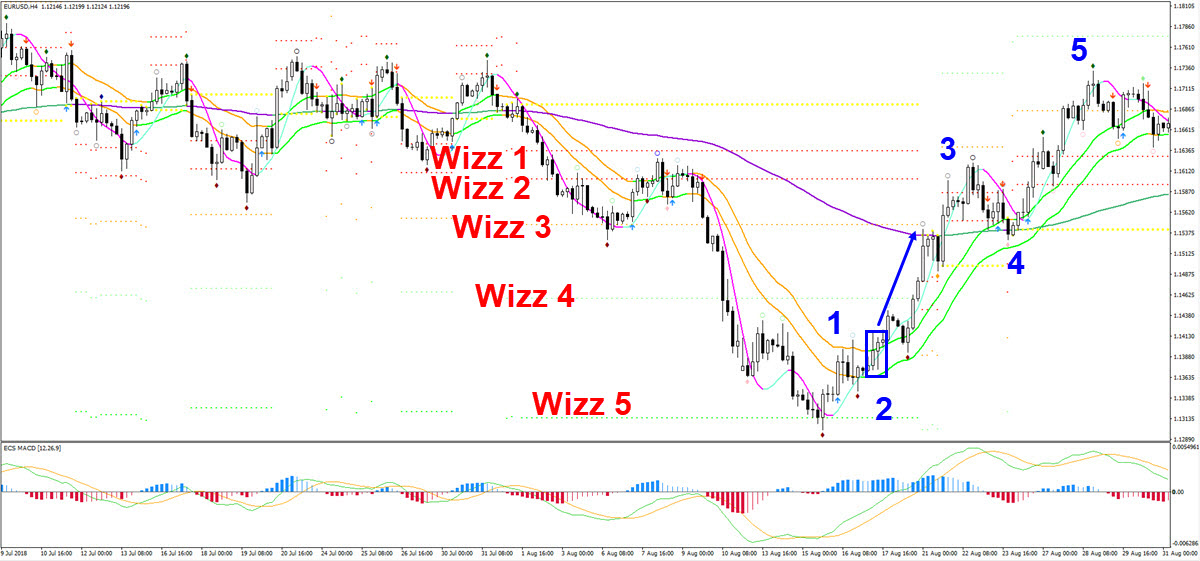
When using the ecs.WIZZ levels (see image below), traders can see that price first fell towards the third Wizz level where price made a bullish bounce. The bearish breakout now has plenty of space as price moves away from the 144 ema. Traders should expect impulsive price and larger price movements away from the 144 ema.
This wide open space is exactly the moment where SWAT traders are expecting impulsive price action towards the higher Wizz levels (red numbers), like Wizz level 4 and 5 (red arrows).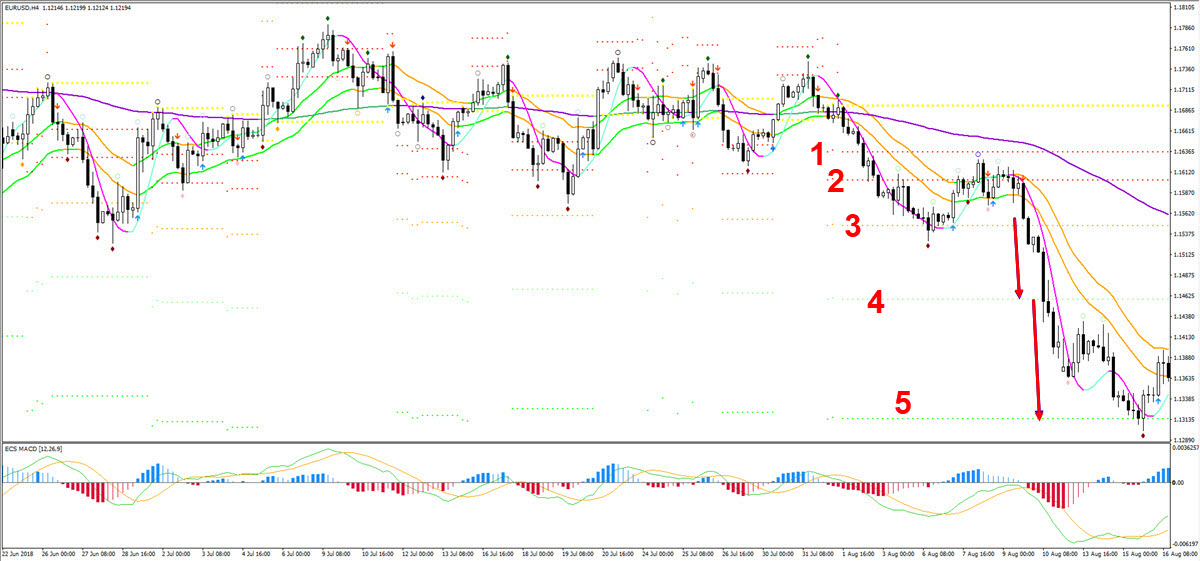
The main question now is: will price extend the downtrend towards the 6th Wizz level or has it completed 5 bearish waves and is the downtrend finished?
Traders can in any case close part of their open setups at Wizz level 5 to lock-in some good profits. Here are the pips made when trading the candlestick bounces or breakouts and closing at Wizz 5:
- The bearish bounce could offer up to 420 pips profit.
- The first bearish breakout could offer up to 350 pips profit.
- The second bearish breakout could offer up to 250 pips profit.
Traders can either fully close or partially close at Wizz 5. This decision depends on whether you think that price can continue lower or whether the trend has ended.
How do you know? The main aspects to keep in mind are the presence of divergence patterns, the response of price at the 21 ema zone, the development of continuation or reversal chart patterns, and the character of price (impulse or corrective).
On the daily chart, there is clear potential for a divergence pattern to emerge as the break of the low could be a wave 5 (see image below).
Furthermore, price also came very close to reaching the -27.2% Fibonacci target (blue box in the image below) when placing the Fib tool on the wave 3.
Furthermore when analysing the 4 hour chart (see image below), price also moved up towards the 21 ema with quite a good bullish momentum, which could indicate a wave 1 reversal (blue). The bullish breakout above the 21 ema makes it even more likely that the trend is either ending (and a bullish reversal is taking place) or price is building a larger retracement towards the 144 ema close.
If traders kept part of their short setups open for larger targets, then this would be the moment to exit the remainder and the entire setup. Using the resistance Fractals just above the 21 ema is an excellent spot for a trail stop loss. Alternatively, trades can wait for a candlestick to close above the Fractal before closing the short setup.
A trail stop loss above the Fractal would give this profit to the short setups:
- The bearish bounce could offer up to 310 pips profit.
- The first bearish breakout could offer up to 240 pips profit.
- The second bearish breakout could offer up to 140 pips profit.

Price not only broke above the 21 ema but also moved above the 144 ema after briefly making a small pullback at the 144 ema close. Price also pulled away from the 21 ema zone for more than 15 candles, which indicates bullish momentum and a likely wave 3 to the upside.
Also, if we add a Fibonacci retracement tool on the wave 1 (see image below) then we can see that price easily made it beyond the -161.8% Fibonacci target, thereby confirming a likely bullish wave 3. The downtrend seems to be over and a new upside more likely. The first warning sign was the failure of price to break below the 5th Wizz level, then the strong bullish bounce at the 5th Wizz level and impulsive move up towards the 21 ema zone, and eventually the breakout above the 21 ema zone. 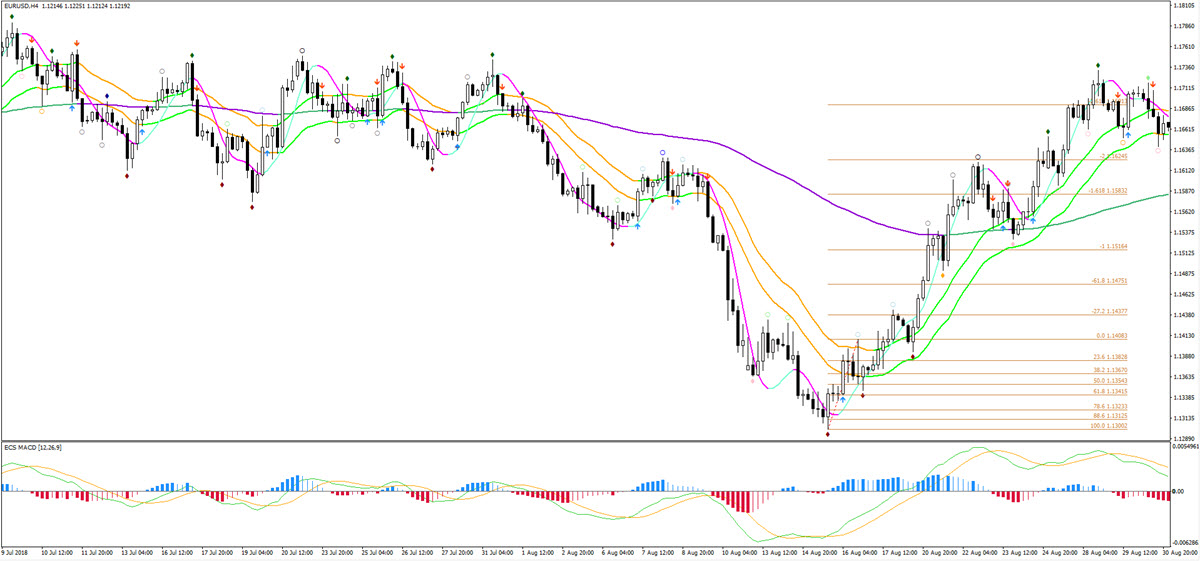
The bullish 5 waves could indicate a larger Wave A of a bullish ABC within a bearish ABC or 123 (see image below).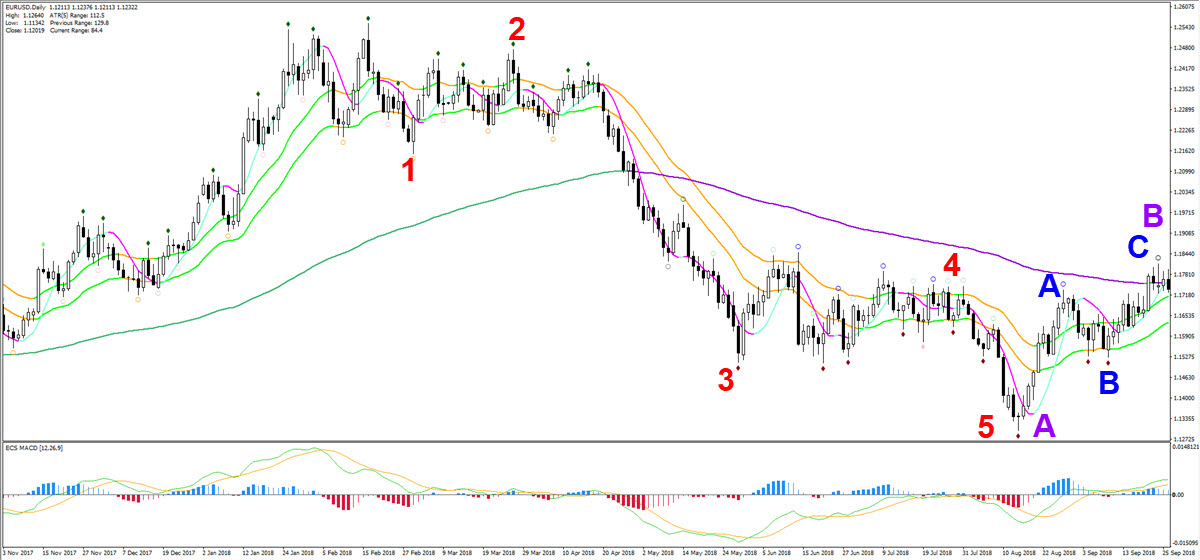
This type of analysis requires quite a lot of work. And the margin of error is of course larger too. This is exactly why we developed the SWAT method so we could simply our decision making process (see next chapter).
The SWAT method helps in many ways, which we will not discuss here but the main advantage is the fact that SWAT is semi-automated.
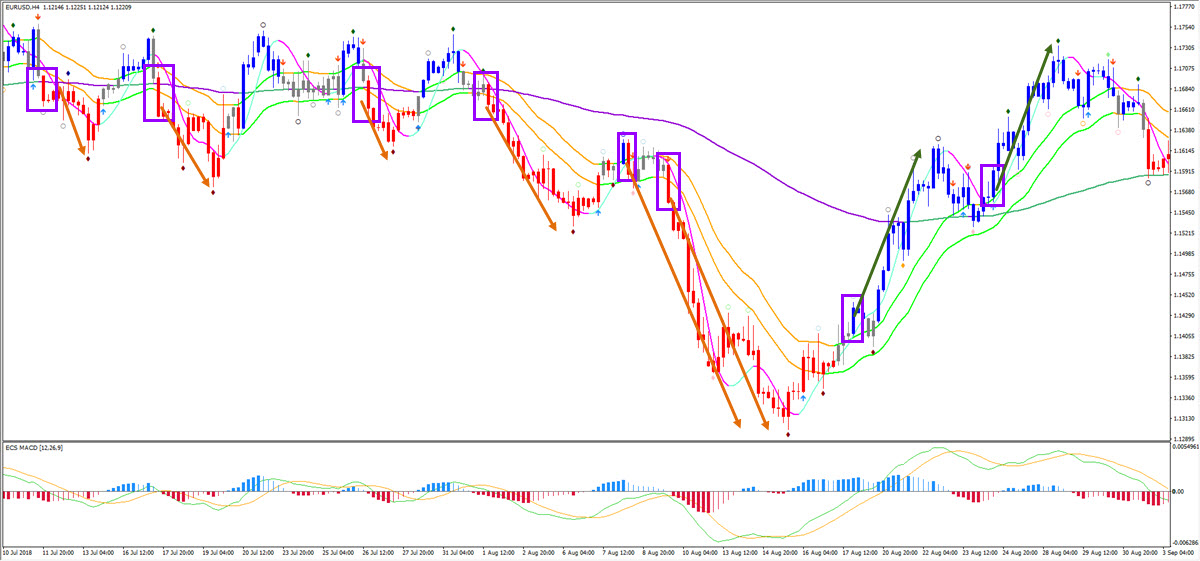
One of the main aspects is the swat.CANDLES. The red candles indicate the moments where price is attempting to break to the downside (red candles in image below).
Of course, traders should still understand the bullish breakout and blue swat.CANDLES are not interesting to trade due to the bearish patterns. The first three breakouts did pretty well and moved 45-80 pips away from the first red candle that close. But the best breakout was of course attempt number 4, 5 and 6. Those red candles saw the price tumble lower and lower after they closed.
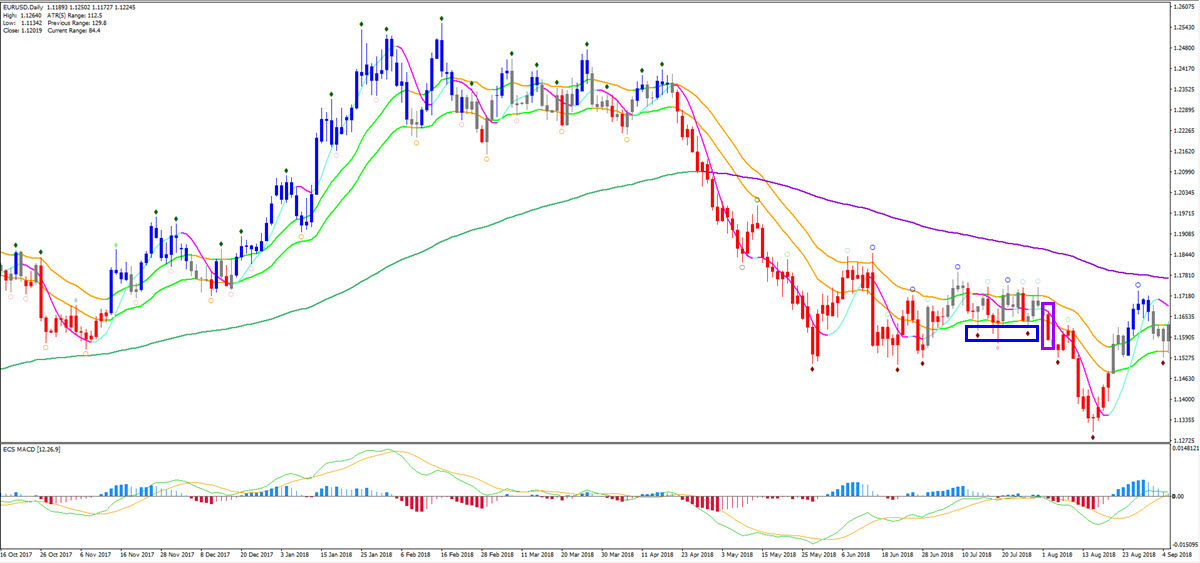
The ecs.SWAT software also showed the same for the daily chart. The red swat.CANDLE with the purple box is the best breakout candle as price is also pushing below the support Fractals and 21 ema zone (blue box).
For more information, free analysis, webinars, videos, tools, systems, and methods for trading stocks, cryptos, Forex and options, please check out my website www.EliteCurrenSea.com.
Wish you good trading,
Chris Svorcik


Leave a Reply