🚀 DAX 30: Long-Term Elliott Wave Analysis for Trading Year 2021 🚀


Dear traders,
the German stock index DAX 30 is testing and breaking the previous highs and double top. Will the bulls be able to break above the resistance during the third attempt?
Price Charts and Technical Analysis
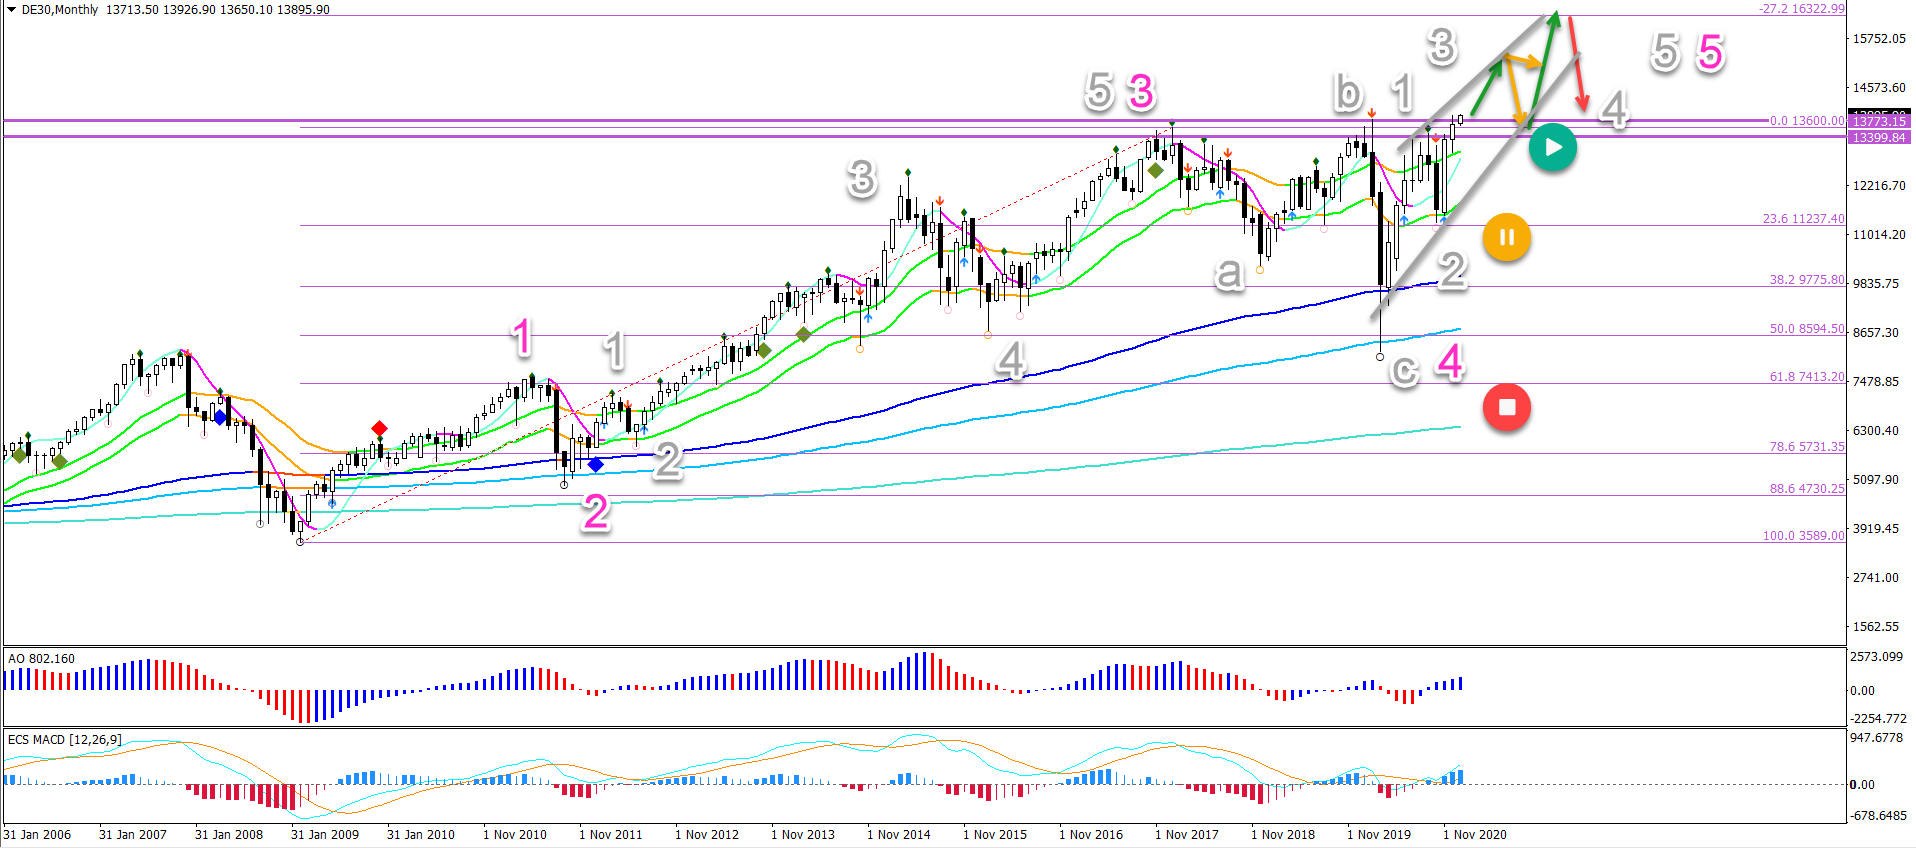
The DAX 30 uptrend is expected to succeed with the 3rd or even 4th breakout. Let’s review the scenarios:
- The bearish swing during March 2020 was probably an impulsive wave C (grey) of a wave 4 (pink) correction.
- Therefore, a bullish breakout above the top could confirm the uptrend and waves 5.
- A 4th attempt to break could occur if price action retests the 21 ema zone again and makes a bullish bounce.
- Only a break below the 21 ema zone places the long-term uptrend on hold (yellow circle). And a break below the 144 ema – 233 ema zone indicates the end (red circle).
The bullish breakout is aiming at the -27.2% Fibonacci target at around $16,000 with $15k also being an important round level.
The push up could become choppier and a rising wedge pattern might occur (grey lines). Also a break, pullback towards the broken resistance, and bounce pattern could develop.
The analysis has been done with the indicators and template from the SWAT method (simple wave analysis and trading). For more daily technical and wave analysis and updates, sign-up to our newsletter.
Good trading,
Chris Svorcik


Leave a Reply