☝️ What to Expect Next After BTC/USD Break Above $50k ☝️
September 6, 2021
3 min read

Dear traders,
Bitcoin (BTC/USD) has managed to break above the psychologically round level of $50k. Can the cryptocurrency challenge the previous high again?
Let’s review the long-term charts to analyse the remainder of the year 2021. Will the 2021 bull run outpace the 2017 bull run?
Price Charts and Technical Analysis
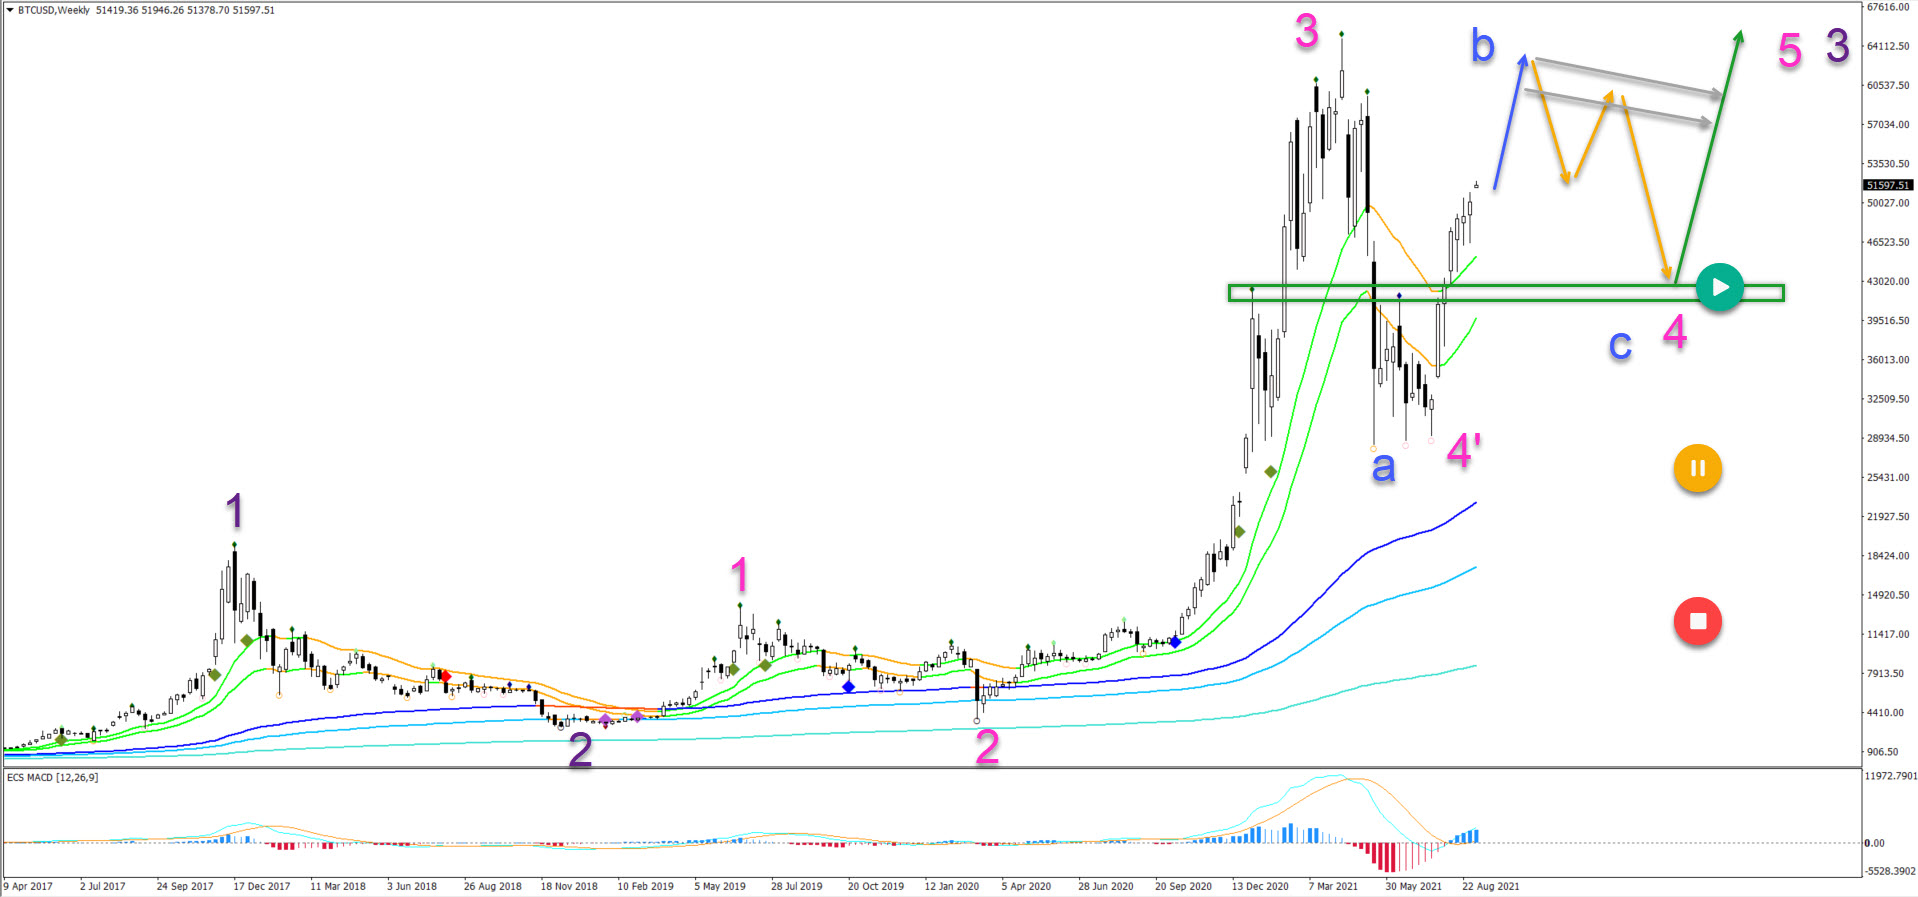
The BTC/USD is showing a strong bullish recovery after a deep bearish pullback:
- Price action has managed to break above the 21 ema zone again.
- The bullish momentum is expected to challenge the previous top (blue arrow).
- The previous top is a strong resistance zone and could stop the uptrend.
- A bearish retracement (orange arrows) could complete an ABC (blue) in wave 4 (pink).
- A bullish bounce (green arrow) could take place at the support zone (green box).
- A bull flag pattern (grey arrows) however indicates that the immediate uptrend remains valid. In that case, a wave 4’ finished at the recent low.
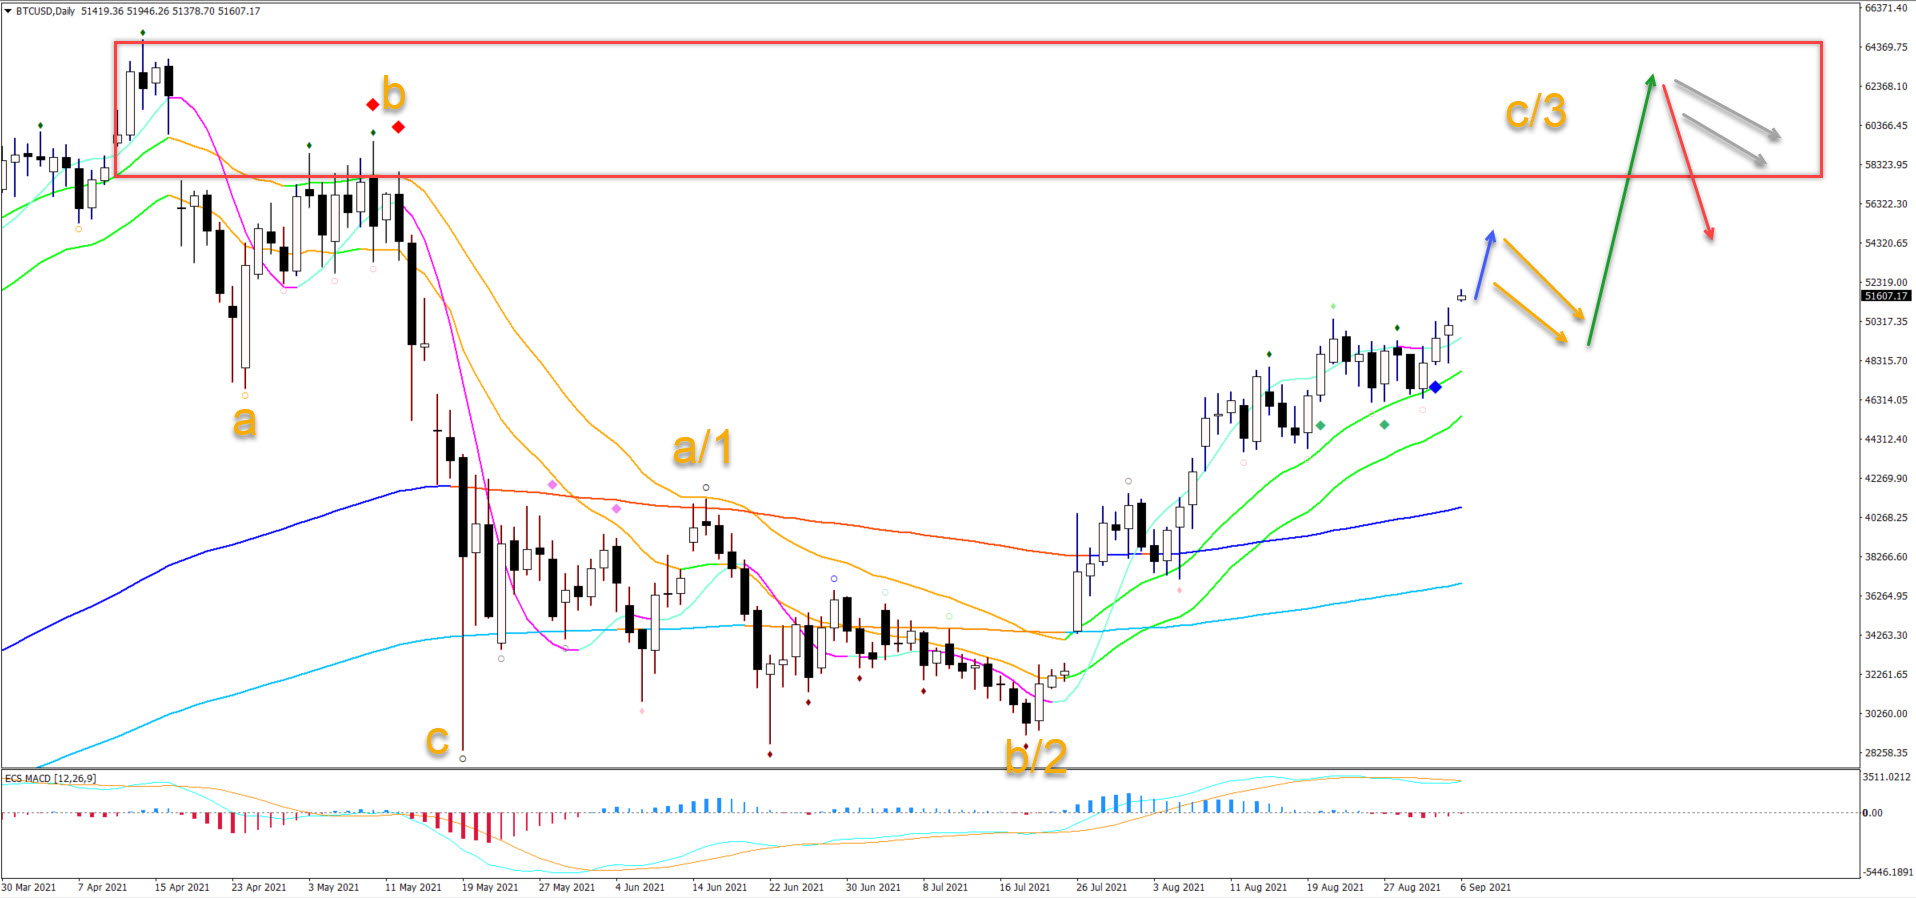
On the daily chart, we see that the bullish momentum is strong because price action remains above the 21 ema zone for a long time:
- The bullish price swing is either a wave C or 3 (orange).
- This depends on the price reaction at the resistance zone (red box).
- A bearish reversal (red arrow) indicates a wave C and more bearish correction.
- A flag pattern (grey arrows) indicates a wave 3 continuation.
The analysis has been done with the indicators and template from the SWAT method (simple wave analysis and trading). For more daily technical and wave analysis and updates, sign-up to our newsletter.
Good trading,
Chris Svorcik


Leave a Reply