☝️ Learn How Bitcoin’s Impulsive Decline Changes the Short-Term Picture ☝️


Dear traders,
Bitcoin (BTC/USD) is showing bearish daily candles below the 21 ema zone on the daily chart. The bearish breakout is invalidating our own wave 4 (pink) analysis.
Despite the strong bearish momentum, the overall uptrend is still valid although price action will need plenty of time before recovering. Let’s review.
Price Charts and Technical Analysis
The BTC/USD decline is certainly very strong – perhaps news was a catalyst. In any case, the bearish fall is likely to scare investors away from BTC/USD for the moment. Either by creating more sellers or stopping buyers from making a purchase.
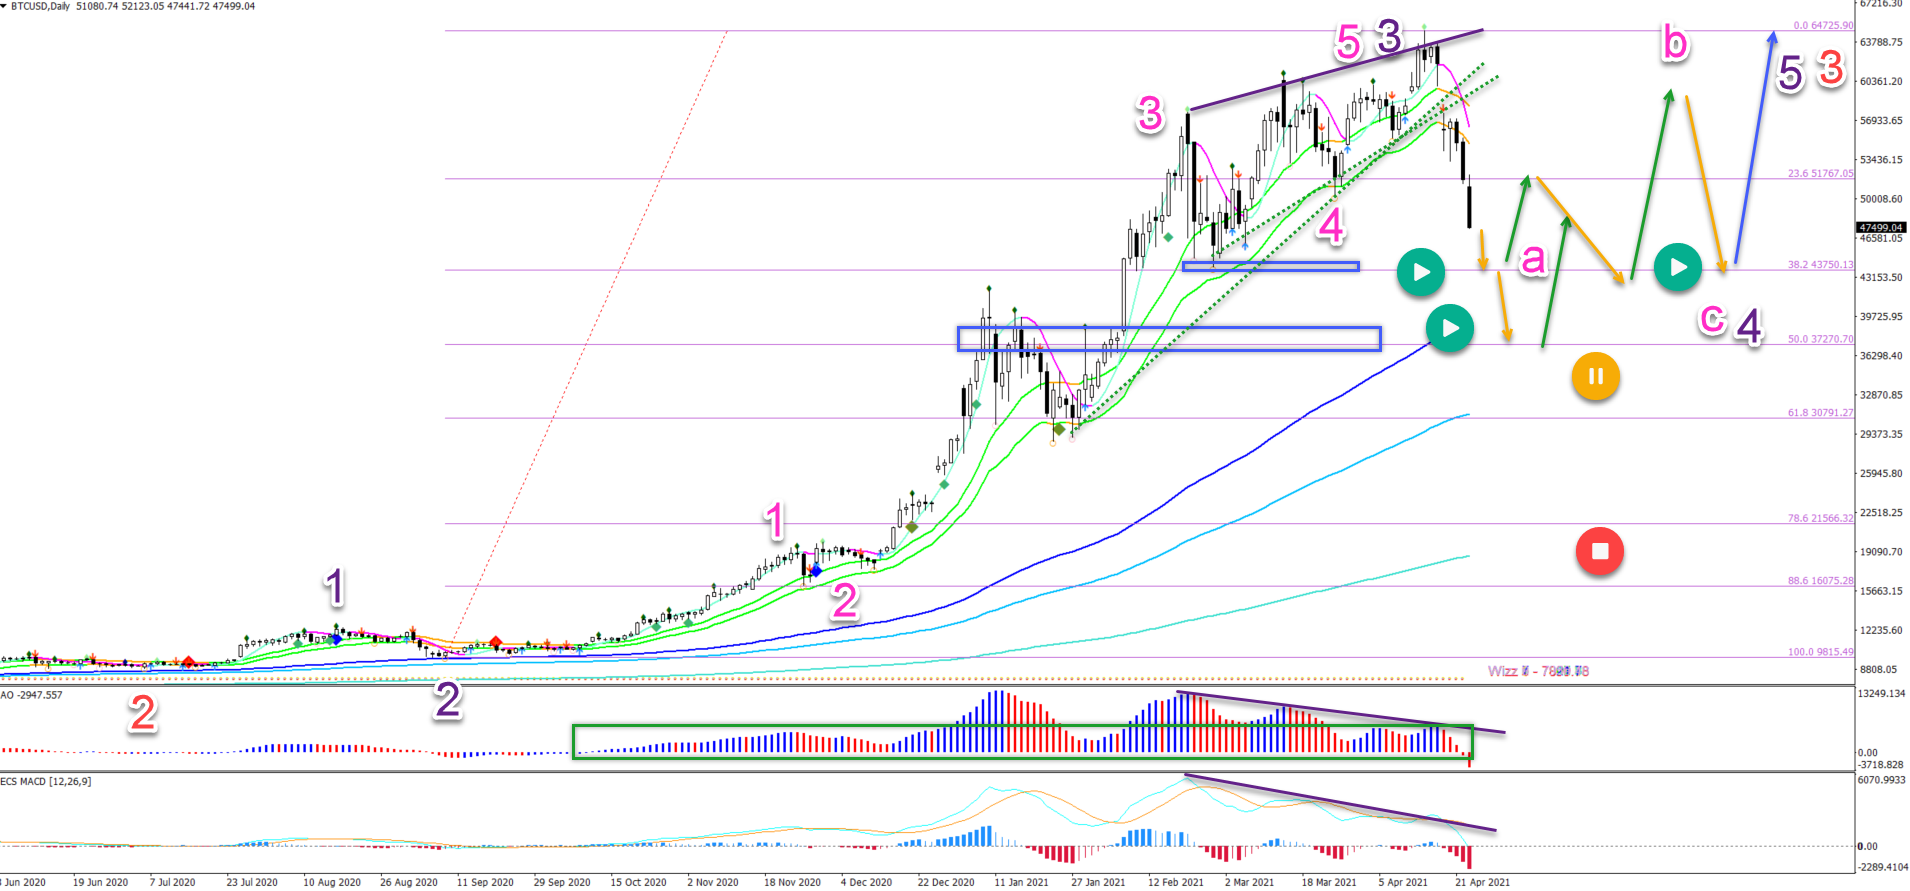
Let’s analyse the daily chart first:
- Price is falling steeply below the 21 ema zone and the HMA 20 has a strong bearish angle.
- But the long-term moving averages are all bullishly aligned with the 21 ema zone above the 144 ema, which is above the 233 and 610 emas. The uptrend remains intact.
- A weaker form of a divergence pattern was visible (purple lines), which means that price could decline as far as the 144 ema zone.
- But it seems that a wave 3 pattern (purple) has been completed when looking at the AO bars (green box).
- The swing started on the left of the green box and ended now with the AO bars crossing from above the zero line to below the zero line.
- The impulsive and strong push up is probably a wave 3 (purple) and unlikely to finish the entire uptrend.
- If price action is making a retracement (orange arrows) within wave 4 (purple), then the shallow Fibonacci levels of the wave 3 should act as support. It will therefore be important to see how price action responds to the 38.2% and 50% Fib.
- A bullish bounce at the Fibonacci level could indicate the end of the decline and confirm a potential wave 4. But the wave pattern 4 is probably not completed yet. A lengthy ABC pattern (pink) is likely to emerge before any uptrend resumes (blue arrow).
- A break below the 50% Fib places the wave 4 and uptrend immediately on hold (orange circle). A deeper break invalidates it (red circle).
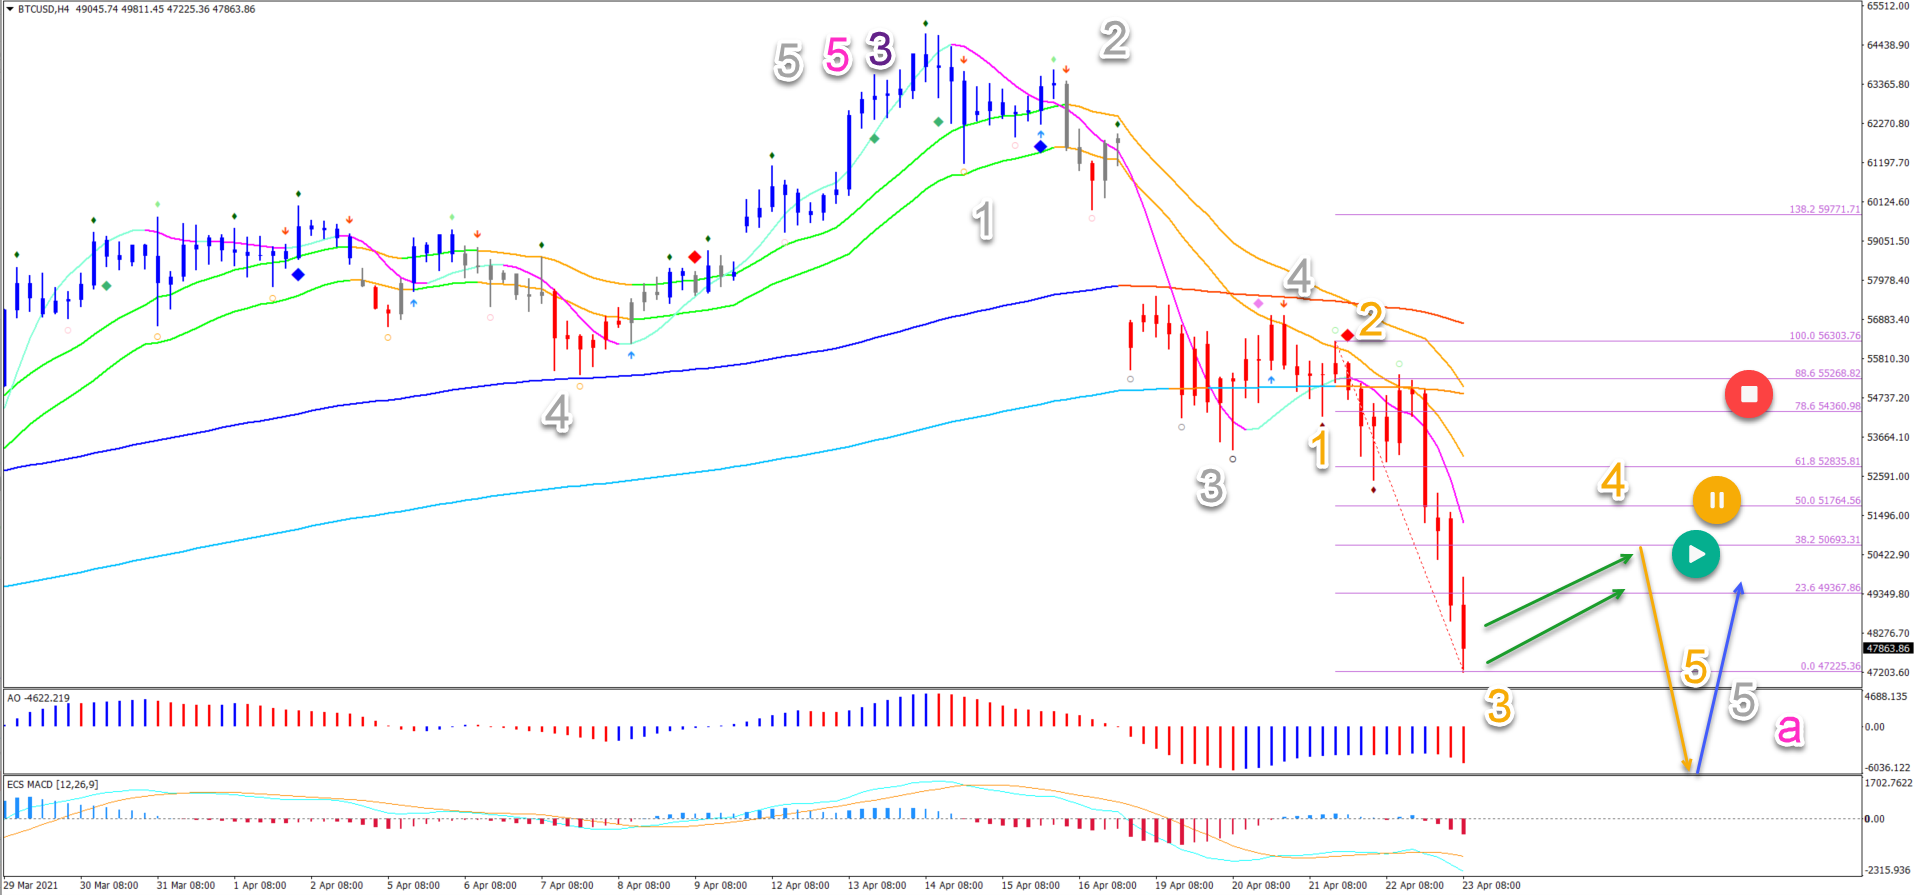
On the 4 hour chart, we see that price action was unable to make any significant bullish bounce at the 144 – 233 ema zone:
- The bearish breakout confirms a 123 (grey) pattern down rather than an ABC.
- The bearish momentum is strong and is probably a wave 3 (orange).
- Any bullish pullback is probably just a wave 4 (orange) and will probably find a new wave of sellers that can push price action lower.
- A strong push up invalidates the bearish wave analysis on the 4 hour chart.
The analysis has been done with the indicators and template from the SWAT method (simple wave analysis and trading). For more daily technical and wave analysis and updates, sign-up to our newsletter.
Good trading,
Chris Svorcik


Leave a Reply