🚀 ETH/USD Key Support Zone in Uptrend of Wave 4 Pattern 🚀

Dear traders,
Ethereum (ETH/USD) is showing significant wicks on both sides of the daily candlesticks. The struggle between bulls and bears is, however, above the 21 ema zone in a strong uptrend (all moving averages are aligned).
Let’s review the daily and 4 hour chart to analyse whether the uptrend can continue.
Price Charts and Technical Analysis
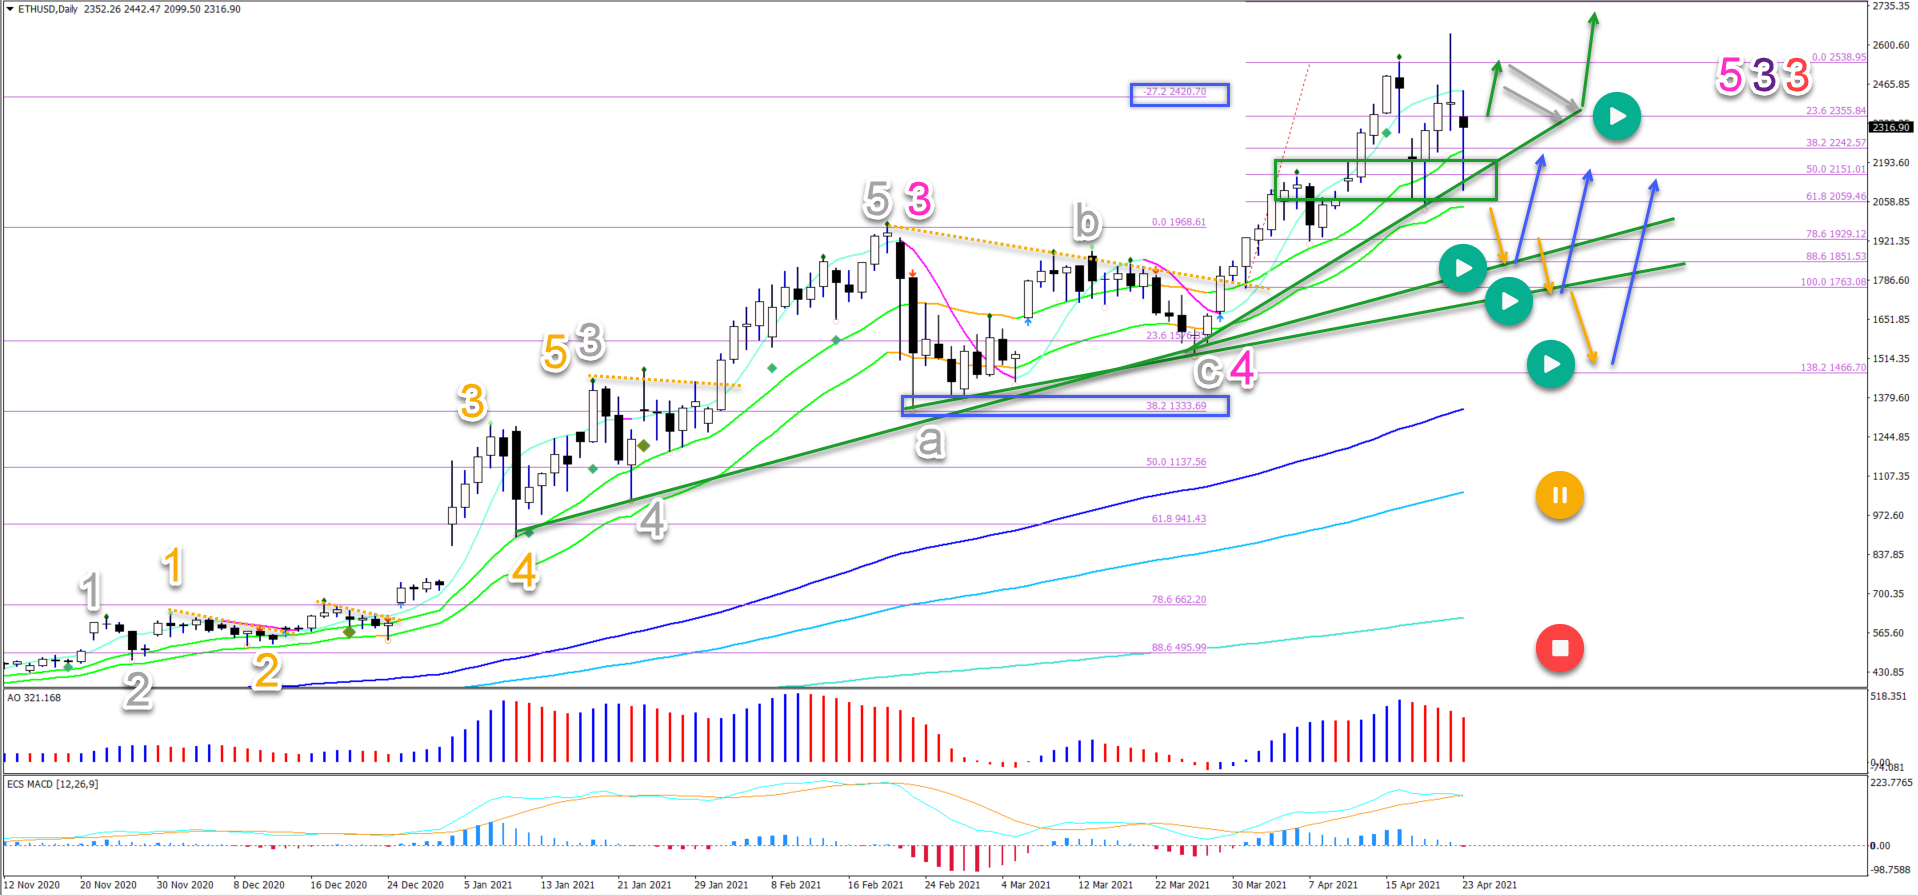
The ETH/USD remains in a well established uptrend. Price action recently completed an ABC (grey) pattern in wave 4 (pink). After that, price action broke above the 21 ema zone for another bullish swing up:
- So far, the bullish swing is not yet completed because the AO bars on the daily chart are still far above the middle line of the oscillator. Price action has bounced from the 38.2% Fib to the -27.2% Fibonacci target.
- This means that price action seems to be in an ongoing wave 5 (pink) for the moment.
- Also, when reviewing price action, bulls seem determined to defend the support zone (green box), the trend lines (green), and 21 ema zone.
- A break below the 21 ema zone indicates the end of the wave 5 (pink) but not the end of the uptrend. Simply because price action is expected to bounce at the lower support levels.
- Only a very deep retracement places the uptrend on hold (orange circle) or invalidates it (red circle).
- An immediate breakout higher (green arrows) could indicate a push towards the -61.8% Fibonacci target around $3,000. A bull flag pattern (grey arrows) could confirm a shallow pullback to the previous top.
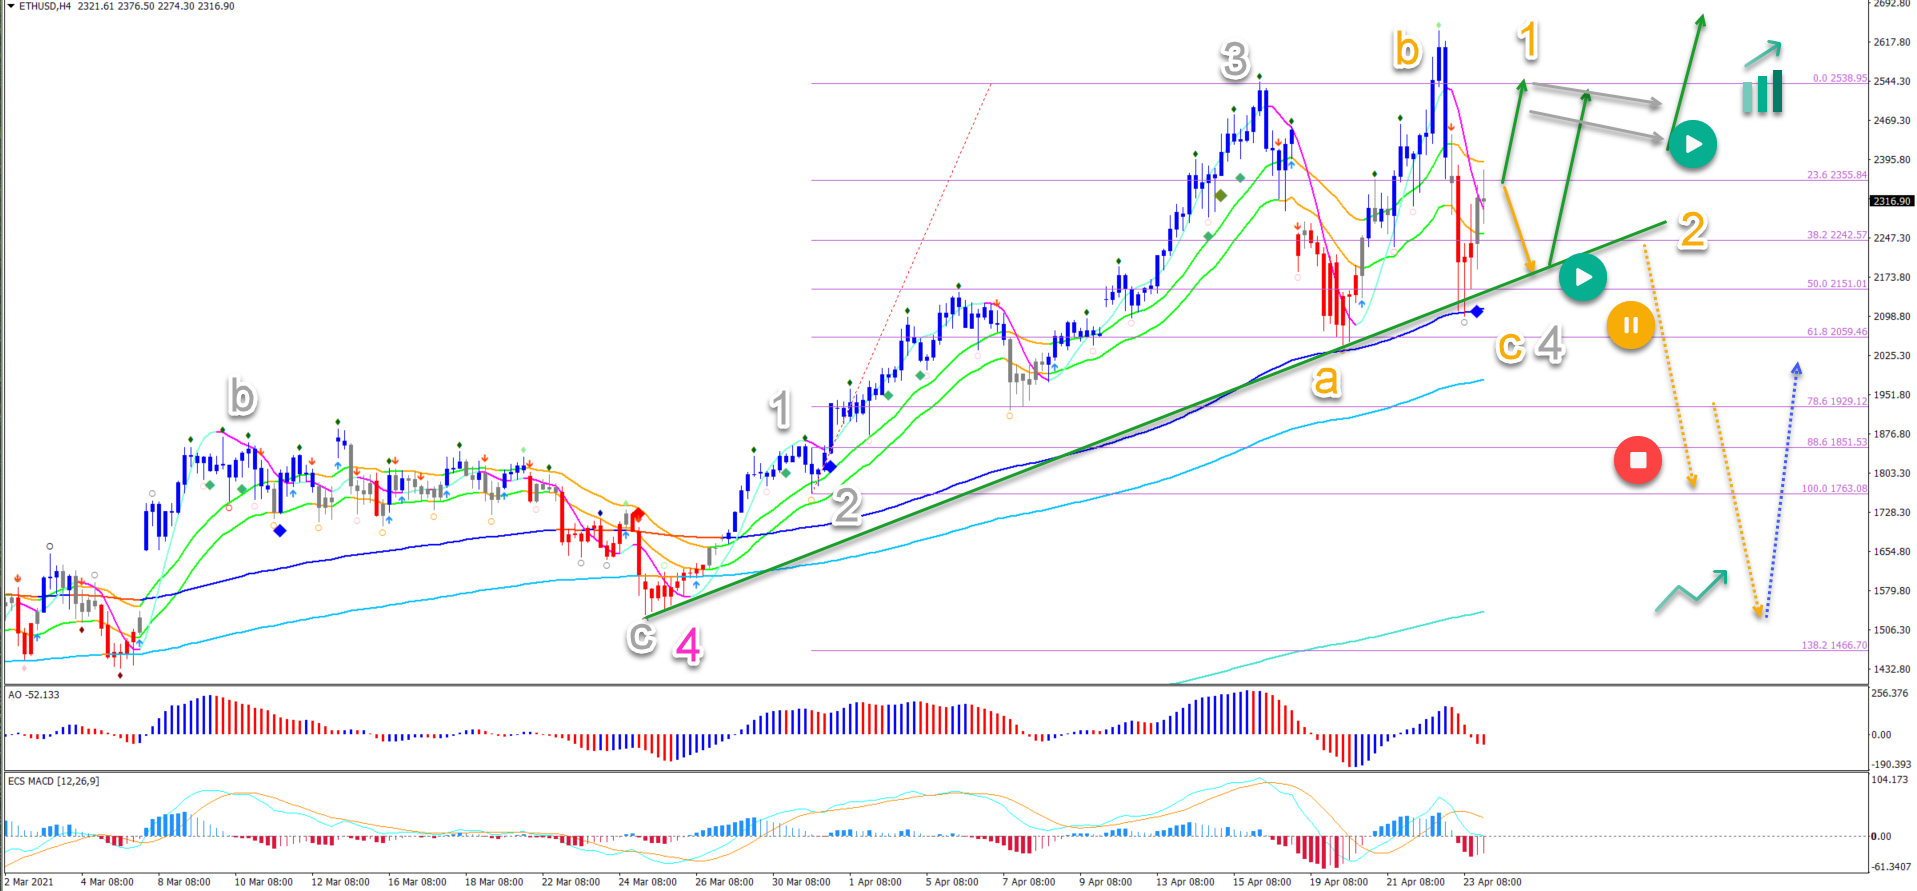
On the 4 hour chart, the roller coaster push up and down seem to be part of an ABC (orange) pattern in wave 4 (grey). Price action is now testing the 21 emas, which is a key decision zone for a breakout or bounce:
- A bullish breakout above the 21 ema zone should confirm an uptrend continuation (green arrow).
- The previous tops can create a bull flag (grey arrows) pattern. A break of that pattern indicates a full uptrend (green arrow).
- A minor pullback (orange arrow) to the support trend (green) could see a bounce (green arrow).
- A bearish breakout (dotted orange arrow) could indicate a deeper wave correction but the uptrend remains valid.
The analysis has been done with the indicators and template from the SWAT method (simple wave analysis and trading). For more daily technical and wave analysis and updates, sign-up to our newsletter.
Good trading,
Chris Svorcik


Leave a Reply