🚀 Bitcoin Uptrend Shows No Signs of Stopping 🚀

Dear traders,
Bitcoin broke above the round resistance levels of $25,000 and $27,500 with ease. The massive bullish momentum seems to be confirming an impulsive wave 3 of a higher degree.
What can traders expect in this bull run? Let’s review the key Fibonacci support levels.
Price Charts and Technical Analysis
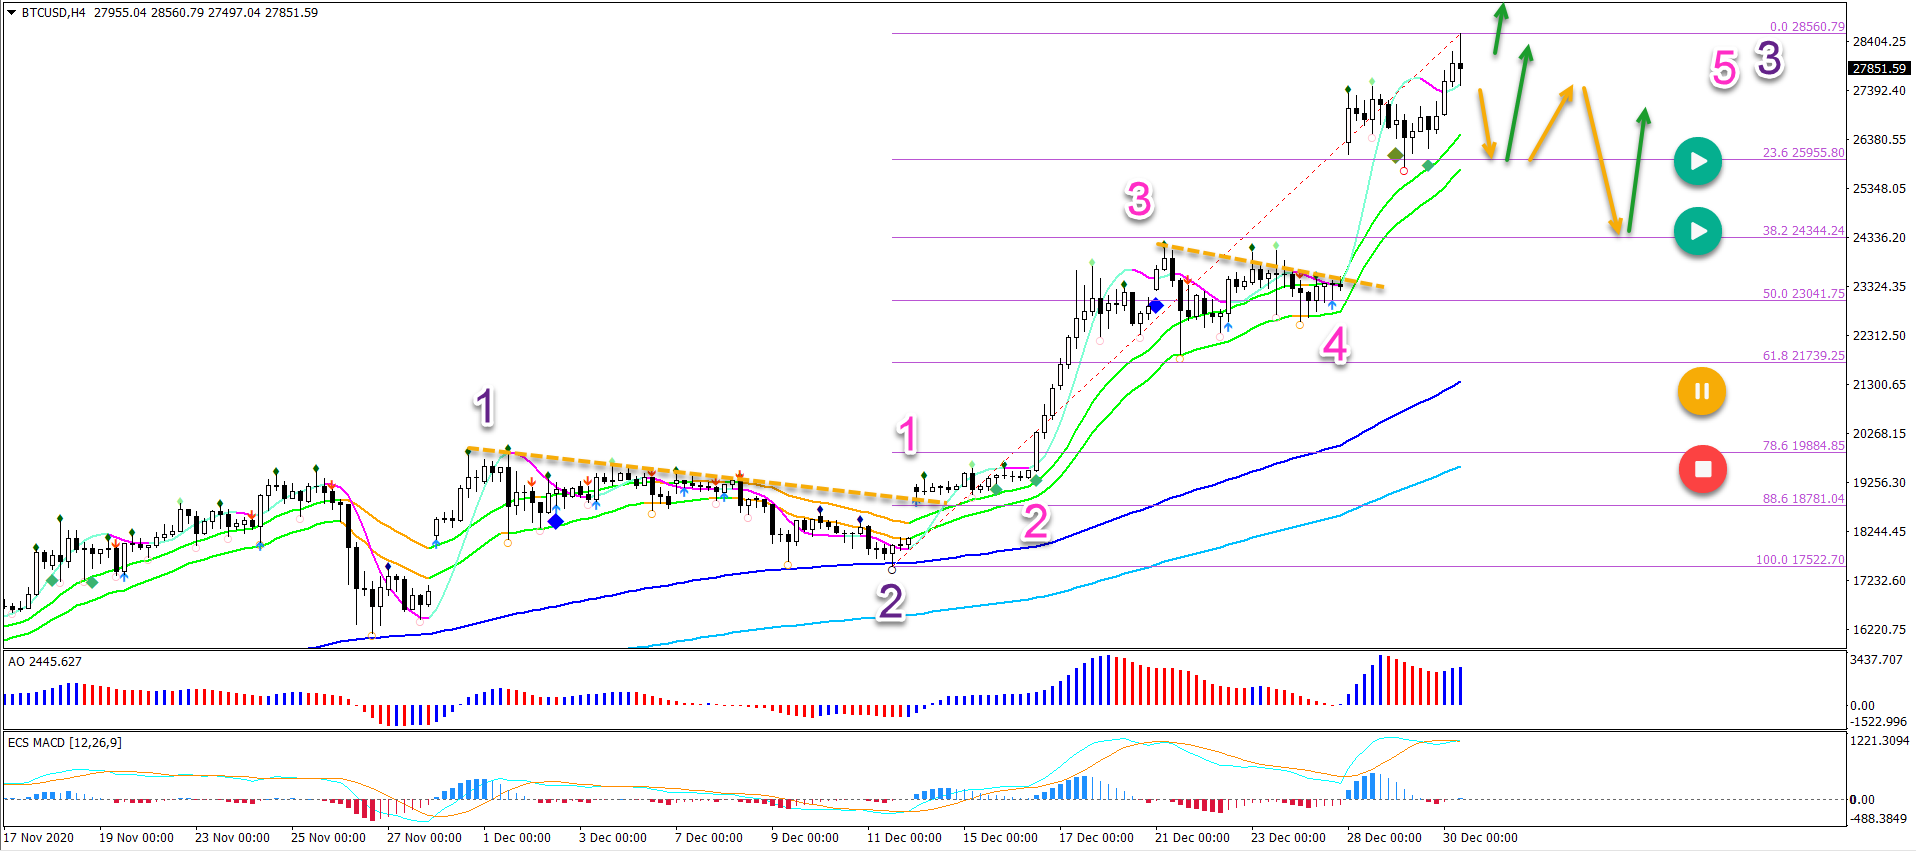
The BTC/USD train is now approaching the $30,000 mark. An immediate push higher (blue arrow) towards the next round level is one of the possibilities.
The 30k target could create some selling and a pullback. However, as long as price action shows choppy corrections, more upside continuation remains the most likely scenario.
Another alternative is that price action will show a retracement before hitting 30k. Then price could fall back to the 23.6% and 38.2% Fibonacci retracement levels. This a potential support zone and bullish bounce.
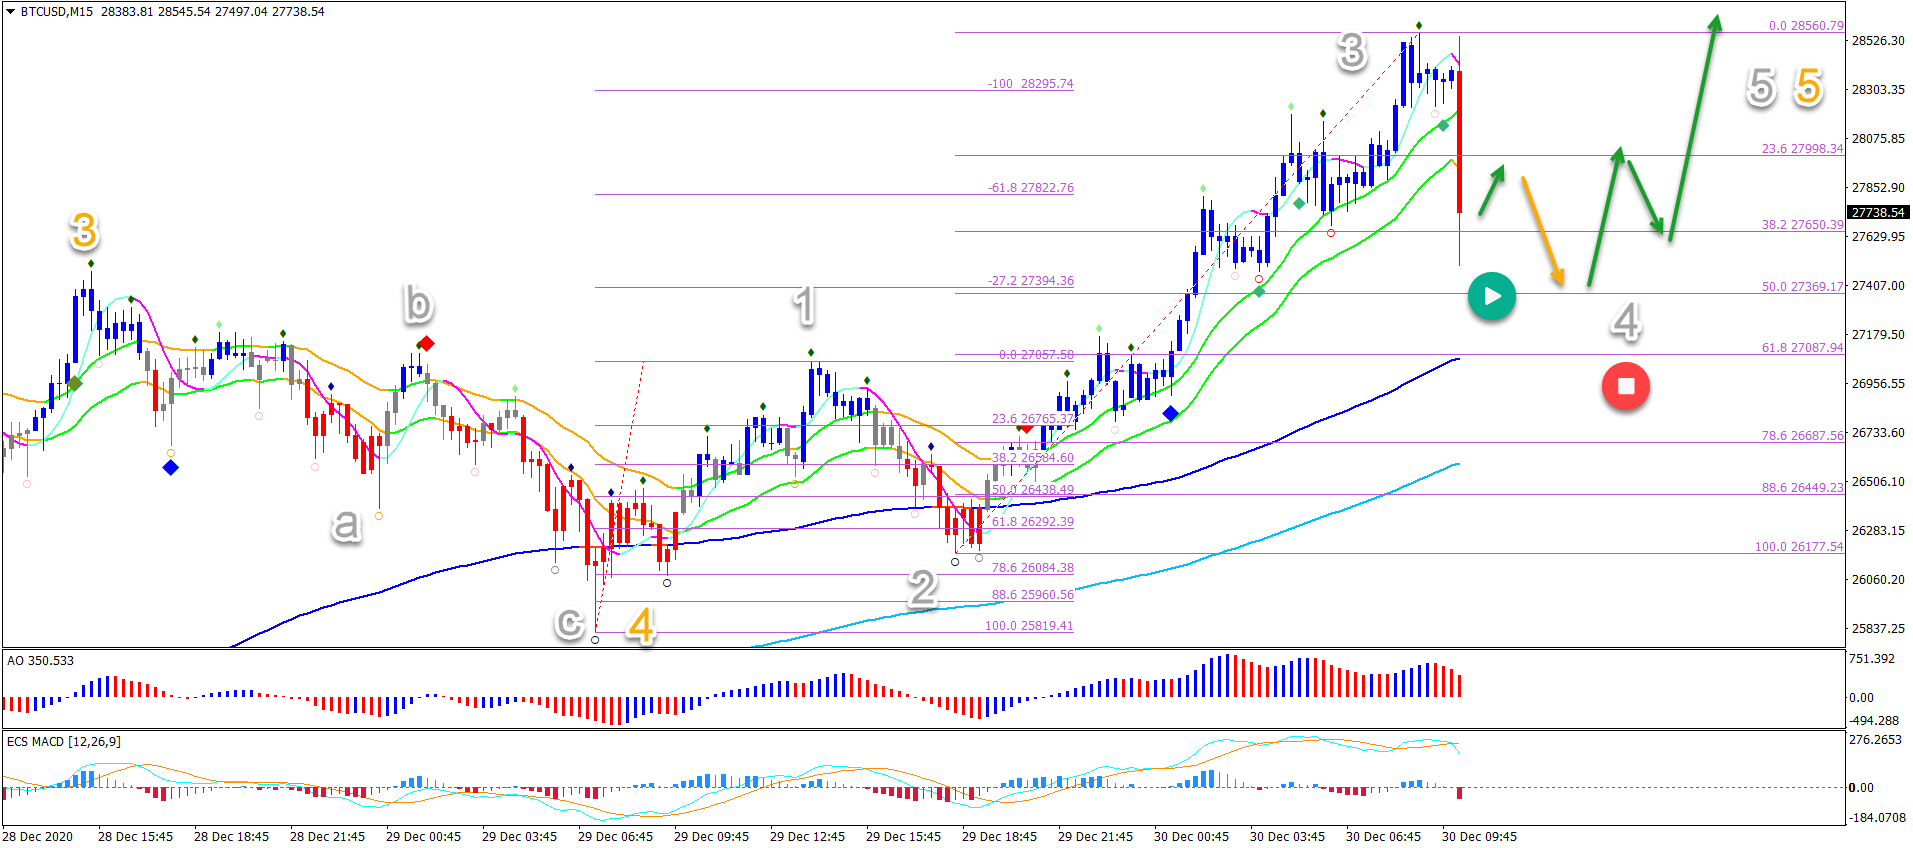
On the 15 minute chart, we can try to estimate whether that immediate continuation will occur or whether price action will create a retracement first.
The key support zone is the 38.2-50% Fibonacci levels. A bullish bounce would confirm a wave 4 (grey) pullback on the lower time frame. And the uptrend could continue within the wave 5 (grey).
Whereas a bearish break below the 61.8% Fib invalidates (red circle) the current wave outlook. This could be a first indication that a deeper pullback is taking place on the 4 hour chart.
The analysis has been done with the indicators and template from the SWAT method (simple wave analysis and trading). For more daily technical and wave analysis and updates, sign-up to our newsletter.
Good trading,
Chris Svorcik


Leave a Reply