💪 Bitcoin Start Triangle After Massive Uptrend Breaks $40k 💪


Dear traders,
the BTC/USD (Bitcoin) has broken above the $40,000 resistance zone after an exceptionally strong move up. Is the trend overstretched? Let’s review the wave and chart patterns.
Price Charts and Technical Analysis

The BTC/USD is not showing any significant signs of a reversal. There is no divergence on the 4 hour chart or higher time frames. Also, the momentum up is very strong.
That said, the counter trend decline did reach the 50% Fibonacci retracement level. This could indicate a deep or longer retracement via an ABC correction or ABCDE triangle.
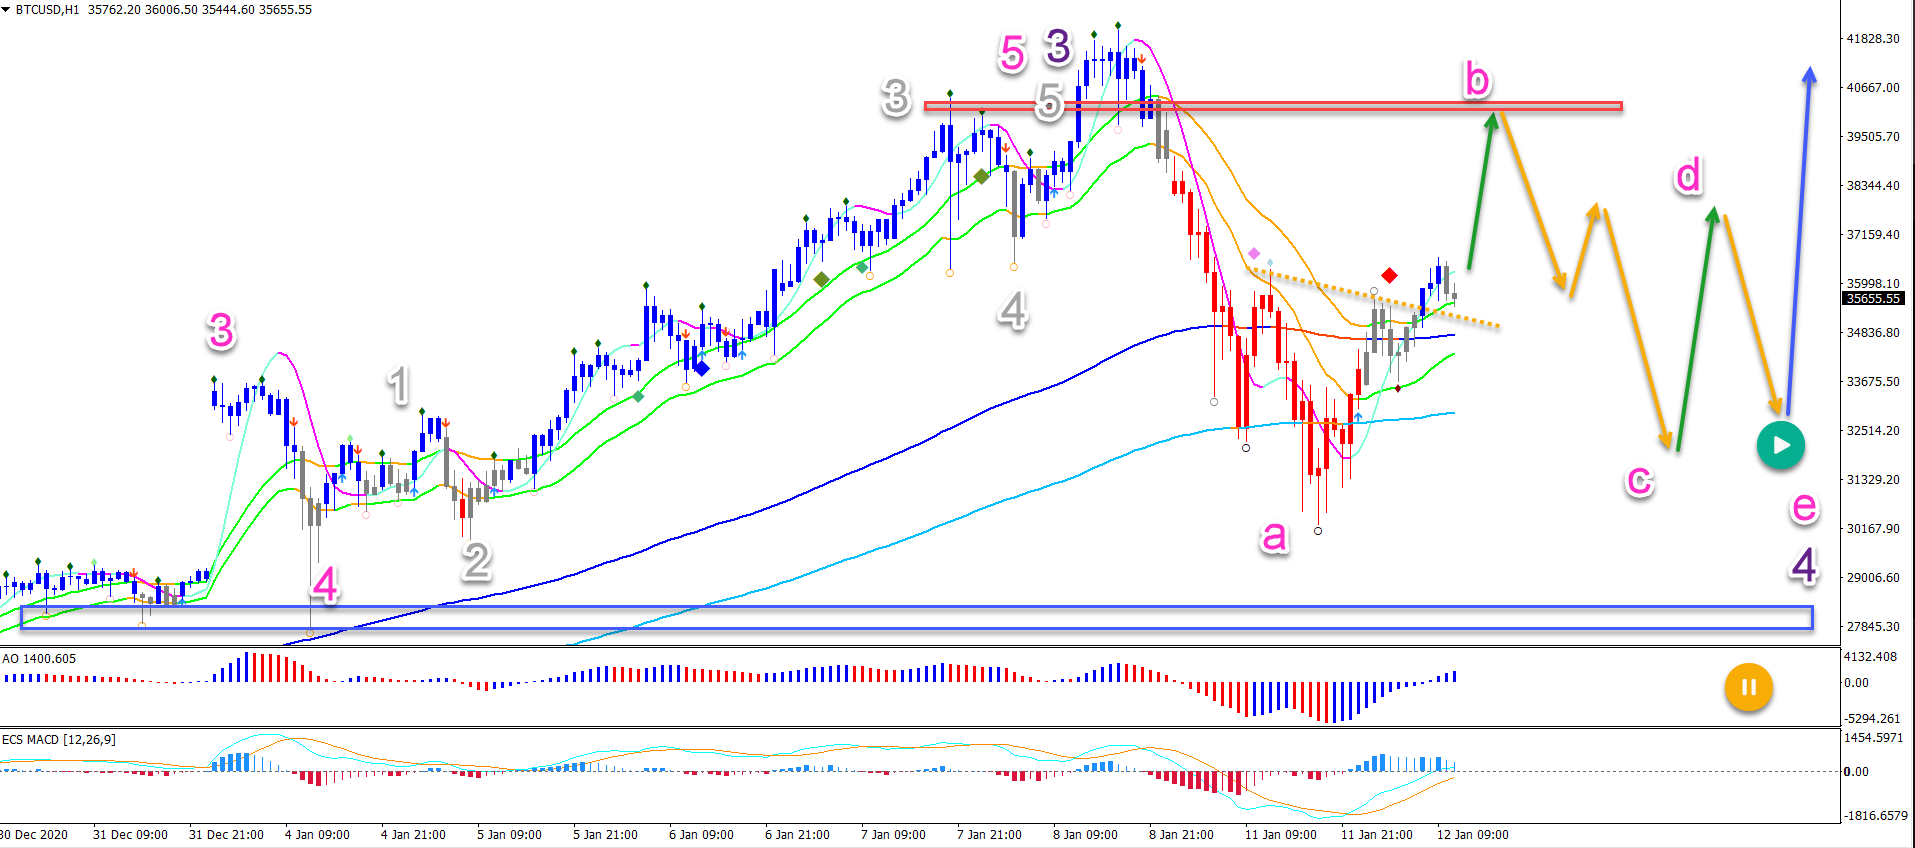
As long as price stays above the 50-61.8% Fibonacci support zone, an uptrend has the best chance of continuing higher (blue arrow) for new high. Only a break below the deep Fibonacci levels would change and invalidate that view.
On the 1 hour chart, price action seems to have completed a wave A (pink) of a wave 4 (purple) correction. The wave could become numerous different types of corrections:
- ABC flat
- ABCDE triangle
- ABC zigzag
The first two options are the most likely scenarios. This means that a deeper retracement towards the resistance and then a bounce back down is the most likely pattern.
The analysis has been done with the indicators and template from the SWAT method (simple wave analysis and trading). For more daily technical and wave analysis and updates, sign-up to our newsletter.
Good trading,
Chris Svorcik


Leave a Reply