🏁 Bitcoin Prepares for Bearish Triangle or Zigzag Pullback 🏁

Dear traders,
Bitcoin (BTC/USD) is showing two lower highs and higher lows. This indicates a bearish correction within the strong uptrend.
A contracting triangle chart pattern seems to have the best papers at the moment. Let’s review the path of least resistance (for more info on this, check out my pattern and MA method).
Price Charts and Technical Analysis
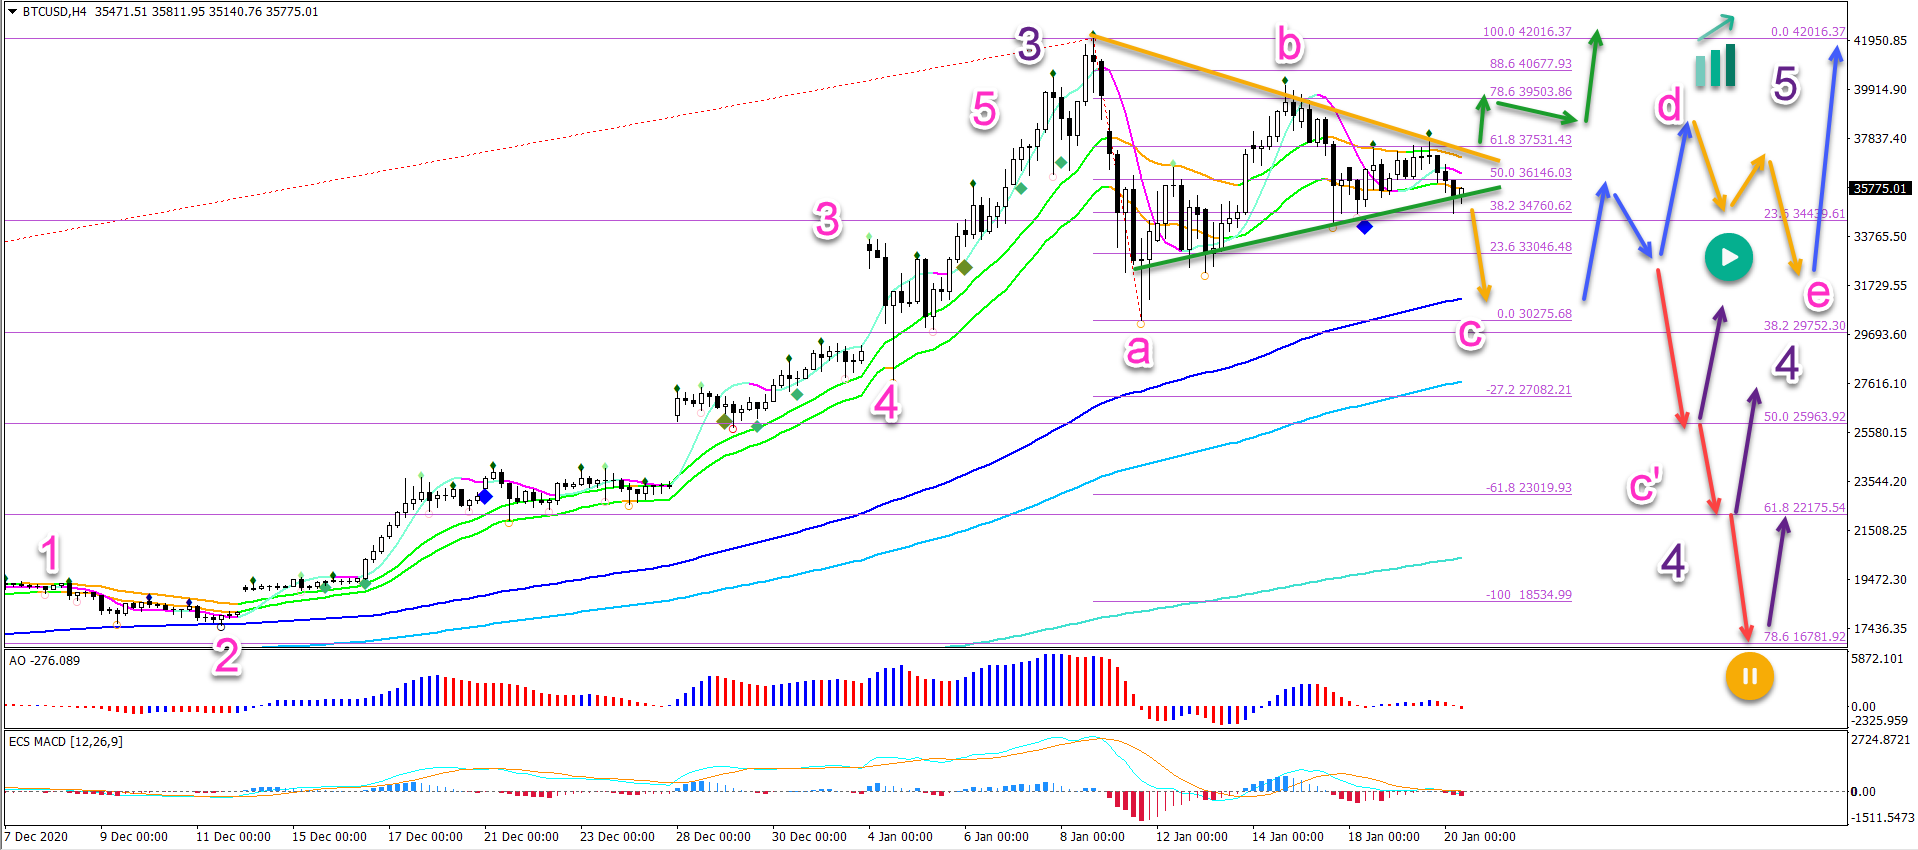
The BTC/USD is expected to stay in a corrective mode for a little longer. But once the correction is completed – either deep towards the Fibonacci retracement levels or shallow via an ABCDE contracting triangle – then the uptrend should resume and aim at the $50,000 target.
The BTC/USD is now building an ABC correction (pink) – ABC flat (sideways) or ABC zigzag (deep correction). This can expand into an ABCDE triangle chart pattern as well:
- A triangle chart pattern is more likely if price action bounces (blue arrows) at the 144 ema and previous wave A bottom.
- A break of the bottom could indicate an ABC zigzag instead (wave C’ pink).
- A wave 4 (purple) correction is expected as long as price action does not break below the 78.6% Fib (yellow circle).
- A bullish trend continuation is expected either after breaking the resistance (green arrows) and showing a bull flag (grey arrows) or after the ABCDE is completed.
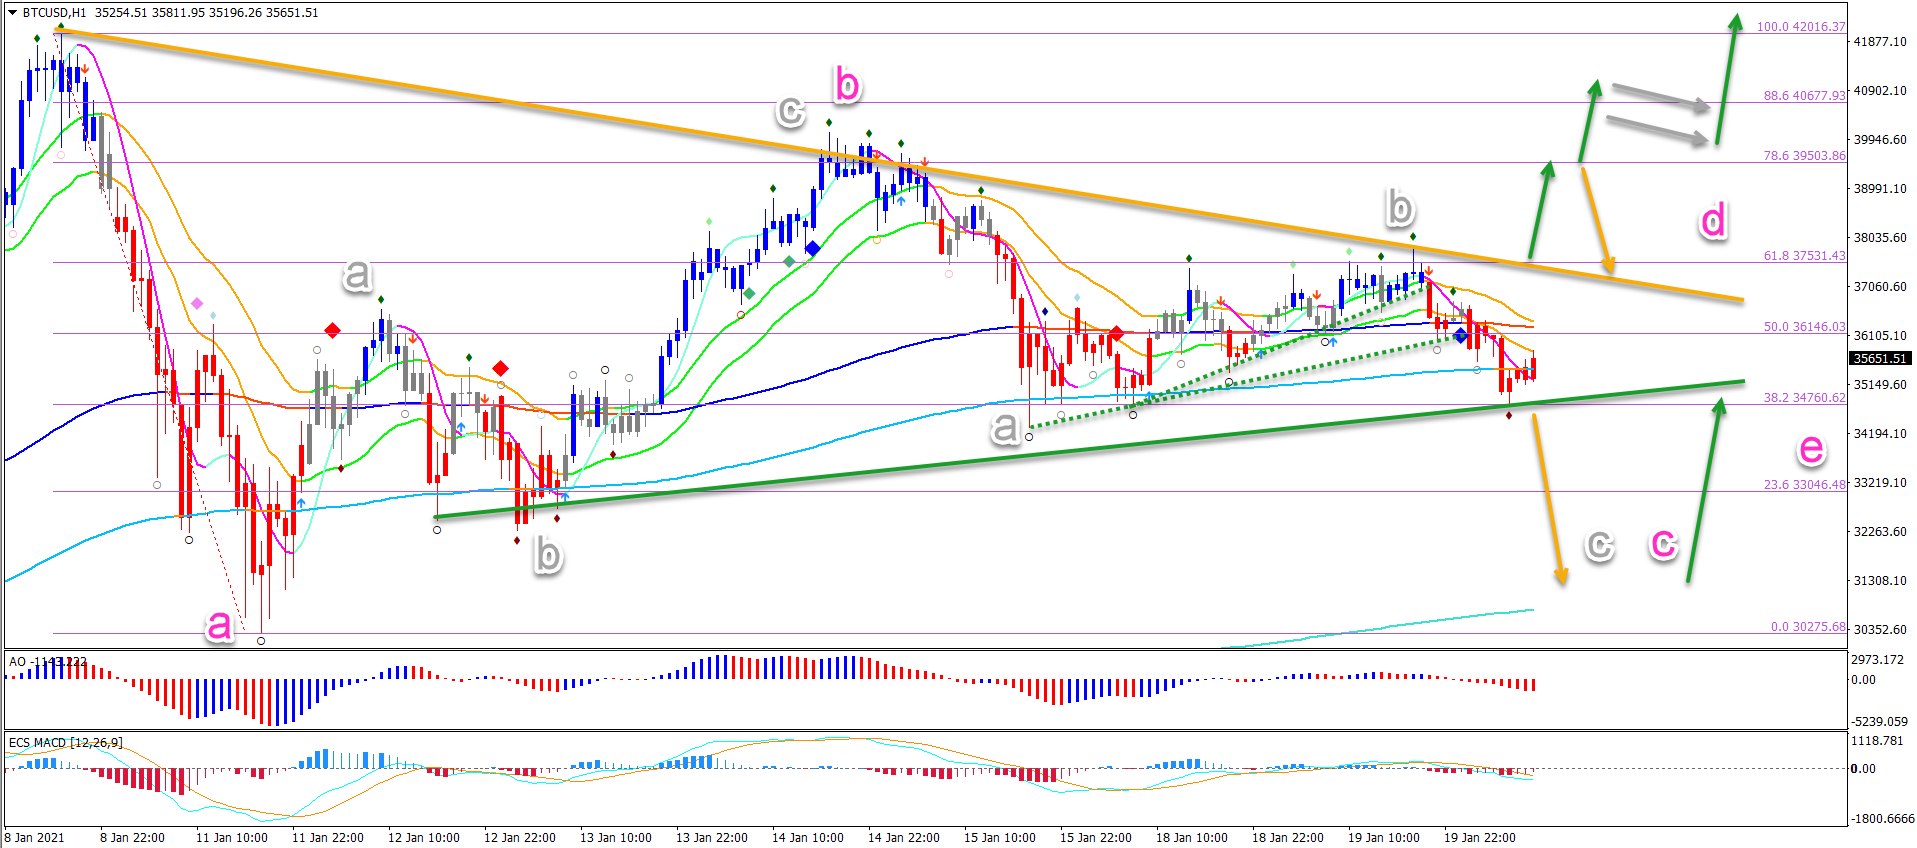
On the 1 hour chart, we can see how the correction is unfolding.
An ABC correction (grey) completed wave B (pink) at the 78.6% Fibonacci retracement level. Now another ABC (grey) is taking place within wave C (pink).
The main criteria will be the breakout above the resistance (orange) or below the support (green) trend lines.
The analysis has been done with the indicators and template from the SWAT method (simple wave analysis and trading). For more daily technical and wave analysis and updates, sign-up to our newsletter.
Good trading,
Chris Svorcik


Leave a Reply