🎯 Bitcoin Decline Breaks 38.2% Fib and Aims at 50% & $37.5k 🎯


Dear traders,
Bitcoin (BTC/USD) made a bearish breakout and one more lower low as expected. But the BTC/USD did not make a bullish bounce at the 38.2% Fibonacci level.
Instead, price action broke below the Fib and is now approaching the 50% Fib level. What can be expected next for Bitcoin?
Price Charts and Technical Analysis
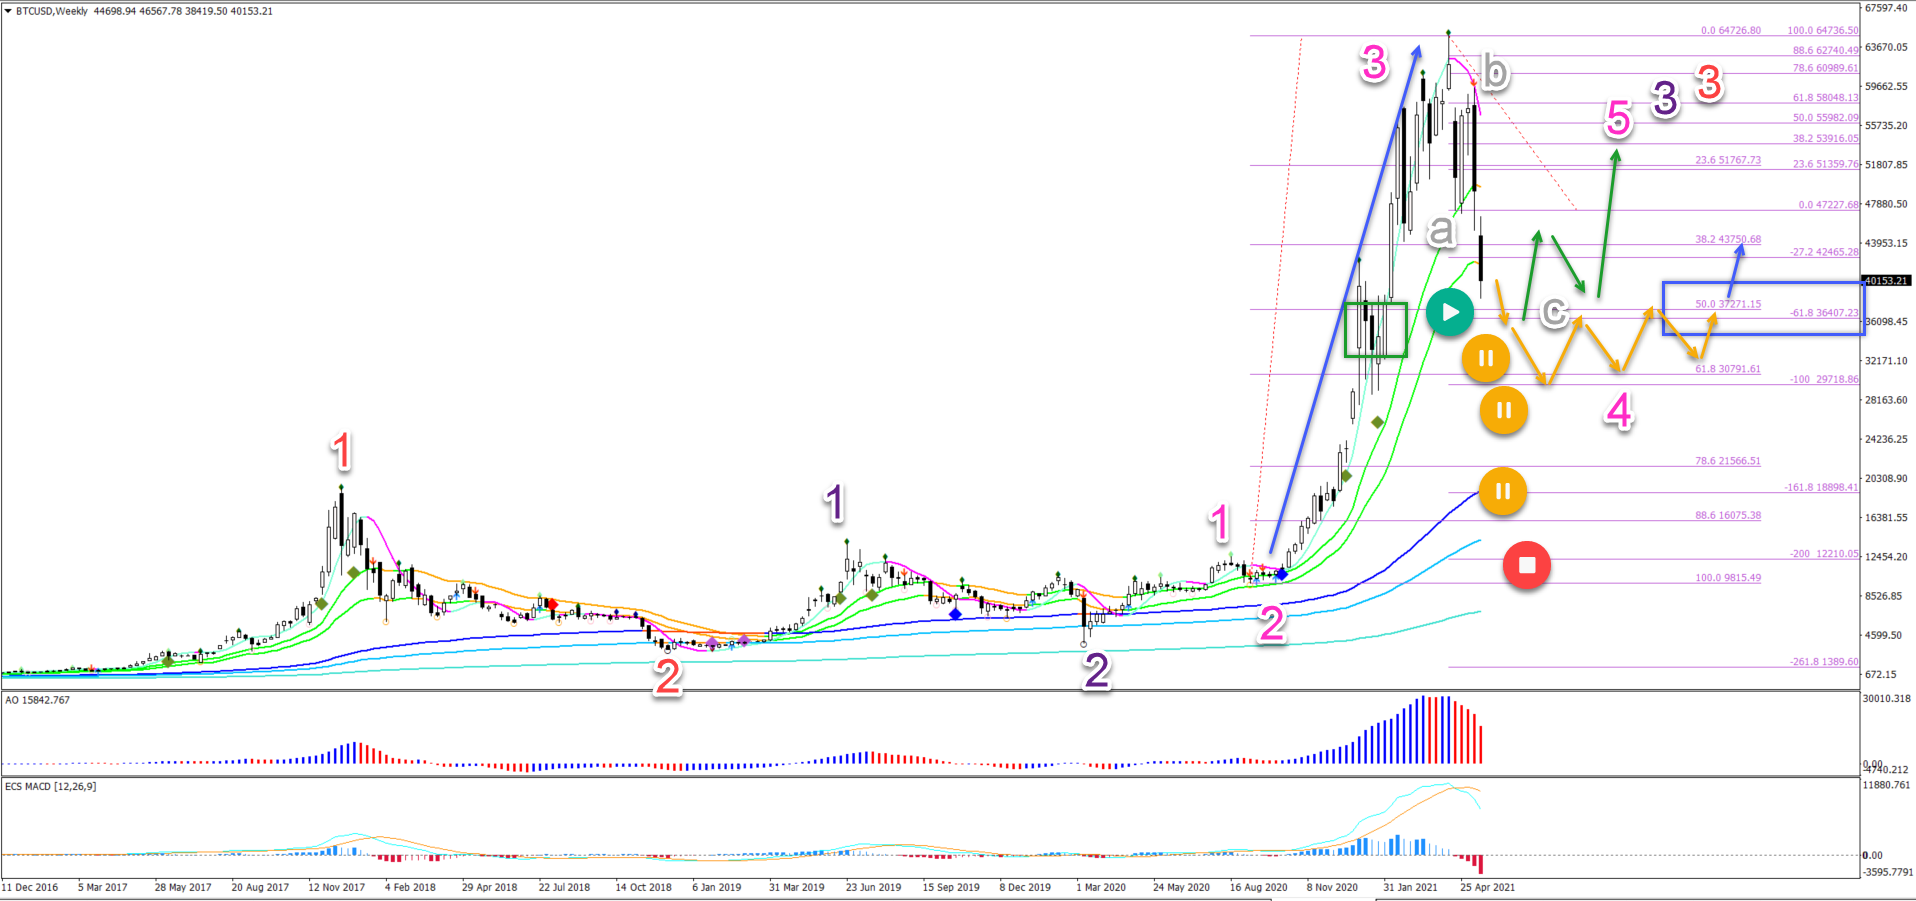
The BTC/USD decline is stronger than previously expected due to the break below the 38.2% Fibonacci level. This could be a first warning signal that price action might be a deep correction:
- If the wave analysis is correct, price action is still in a wave 4 (pink) as previously mentioned.
- This is valid as long as price action remains above the 50% Fibonacci level near $37,500. Two other aspects help the support zone: the 21 EMAs and the sideways zone (green box).
- A break below 50% Fibonacci level and every Fib below it however is a warning signal (orange circles) that the wave 4 (pink) outlook might be incorrect.
- A break below the 88.6% Fib invalidates the wave 4 (red circle).
- If the wave 4 pattern (pink) is correct, then there are 2 main scenarios for a recovery. The first one is indicated by the green arrows: a strong bullish rebound.
- The second scenario is price action will slowly respond to the support zone. This is indicated by the orange arrows. This is a phase where price action carefully turns up with many dips to test the support zone before moving up later on (blue arrow). This is the most likely scenario at the moment due to the strong bearish price action.
- If our wave analysis is correct, then the wave 4 (pink) could be lengthy but eventually, a new uptrend could send it higher within a wave 3 (purple) of wave 3 (red).
On the 1 hour chart, price action is building lower lows as part of the wave C (grey). The bullish price action are wave 4 pullbacks:
- The current pullback could also be a wave 4 (green) of a lower degree,
- A bearish bounce at the Fibonacci levels could indicate at least one more lower low.
- The main target of the bearish price action is the 50% Fibonacci support zone around $37,500.
- A bullish bounce could occur at the target (blue arrows).
- A break (green arrows) above the 50-61.8% Fibonacci however could indicate the end of the 1 hour downtrend.
- The main target of a bullish break is the resistance zone (red box), which could create a bearish bounce (orange arrows).

The analysis has been done with the indicators and template from the SWAT method (simple wave analysis and trading). For more daily technical and wave analysis and updates, sign-up to our newsletter.
Good trading,
Chris Svorcik


Leave a Reply