🏁 Can GBP/USD Bearish Reversal Signals Stop the Uptrend? 🏁
May 25, 2021
4 min read

Dear traders,
the GBP/USD is moving up again. Can the uptrend continue or will a reversal finally take place?
This Elliott Wave analysis will explain why a reversal seems to have better odds. Let’s start.
Price Charts and Technical Analysis
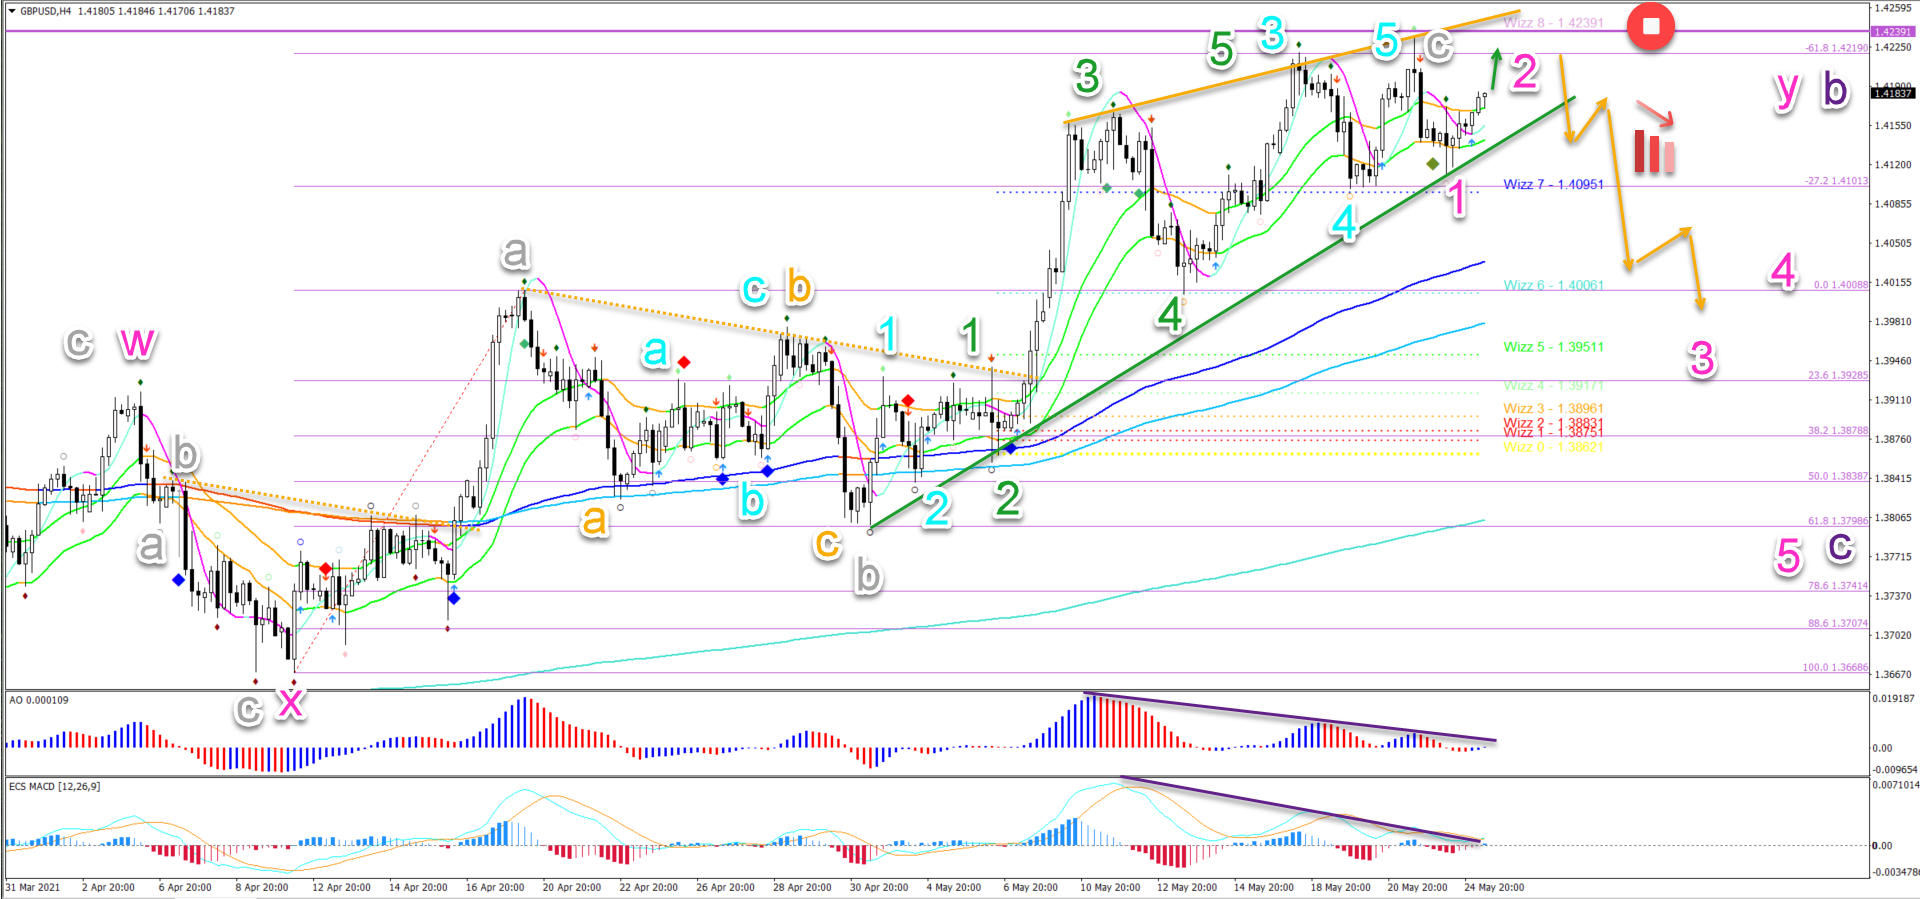
The GBP/USD chart offers multiple factors that make a bearish reversal more likely. Of course, any reversal analysis is always more risky because trends tend to be strong and continue. But here are the main factors in our eyes:
- The GBP/USD is testing the previous daily top (purple), which is a strong resistance zone.
- The GBP/USD has reached the -61.8% Fibonacci target and Wizz 8 level, which is a key target zone.
- A wave C (grey) usually bounces at the -61.8% Fib target. A break above this target could indicate a wave 3 rather than a wave C.
- A rising wedge reversal chart pattern seems to be also unfolding. The highs are much lower and the lows are higher.
- A divergence pattern is also visible (purple lines) on the oscillator, which indicates that the uptrend is losing steam.
- A bullish WXY (pink) complex correction seems to be finished. A bullish ABC (grey) pattern seems to finish wave Y (pink).
- A break above the top invalidates (red circle) this bearish reversal.
- A break below (orange arrows) the support trend line (green) could confirm the reversal and a potential 123 (pink) wave pattern.
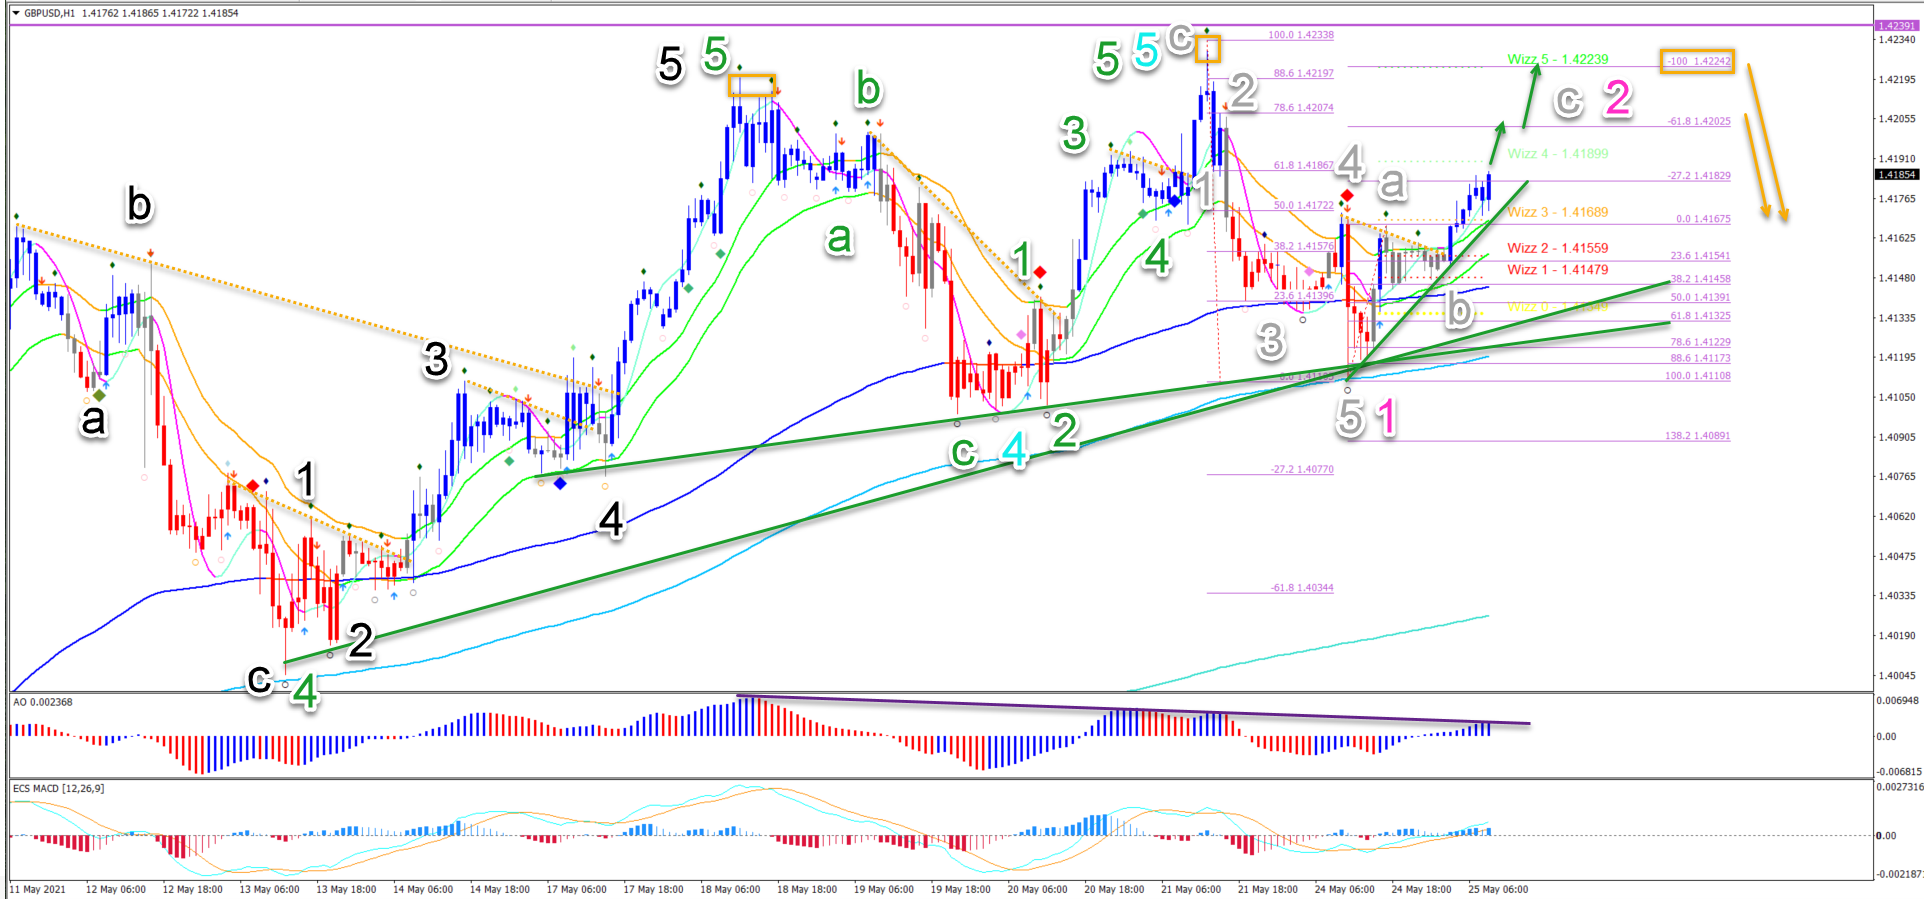
On the 1 hour chart, there is some indication of a reversal as well.
- Even if the top breaks by a small margin, it could still become a triple top or be part of the rising wedge. But not the bearish wave 12 (pink) that we are showing here.
- A bearish bounce (orange arrows) could confirm a head and shoulders reversal chart pattern.
- A 5 wave pattern (grey) could complete wave 1 (pink).
- A bullish ABC (grey) could complete wave 2 (pink).
- A breakout below the 21 ema zone and the 144 – 233 ema zone could confirm the reversal.
The analysis has been done with the indicators and template from the SWAT method (simple wave analysis and trading). For more daily technical and wave analysis and updates, sign-up to our newsletter.
Good trading,
Chris Svorcik


Leave a Reply