💪 AUD/USD Bulls Ready to Wrestle Back Control Towards 0.7325 💪


Dear traders,
the AUD/USD made a break below the 21 ema after a lengthy ride above it. Price is now testing that 21 ema zone as a resistance. Will price break or bounce?
Price Charts and Technical Analysis
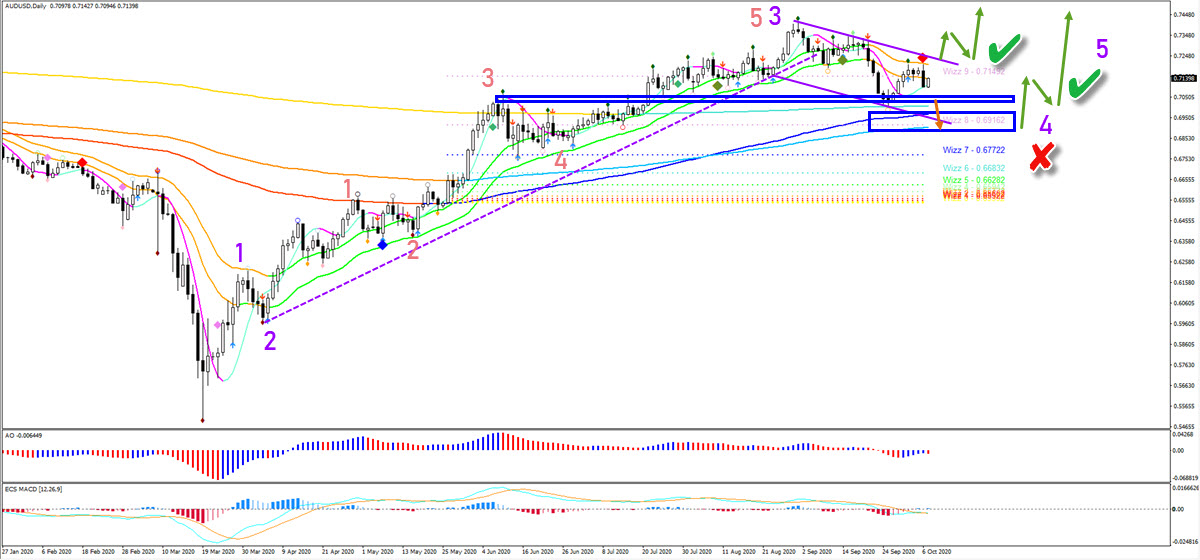
The AUD/USD showed a strong bearish daily candle yesterday. But overall, the long-term trend remains bullish and eventually a bullish breakout is expected. If price action does break below bottom (blue box), then a push lower to test those long-term MAs (second blue box) is likely. We do expect a bullish bounce there. A break below that zone would make the bullish outlook less likely (red x). Otherwise a wave 4 (purple) remains the key pattern for the moment and a breakout increases the chance of a wave 5.
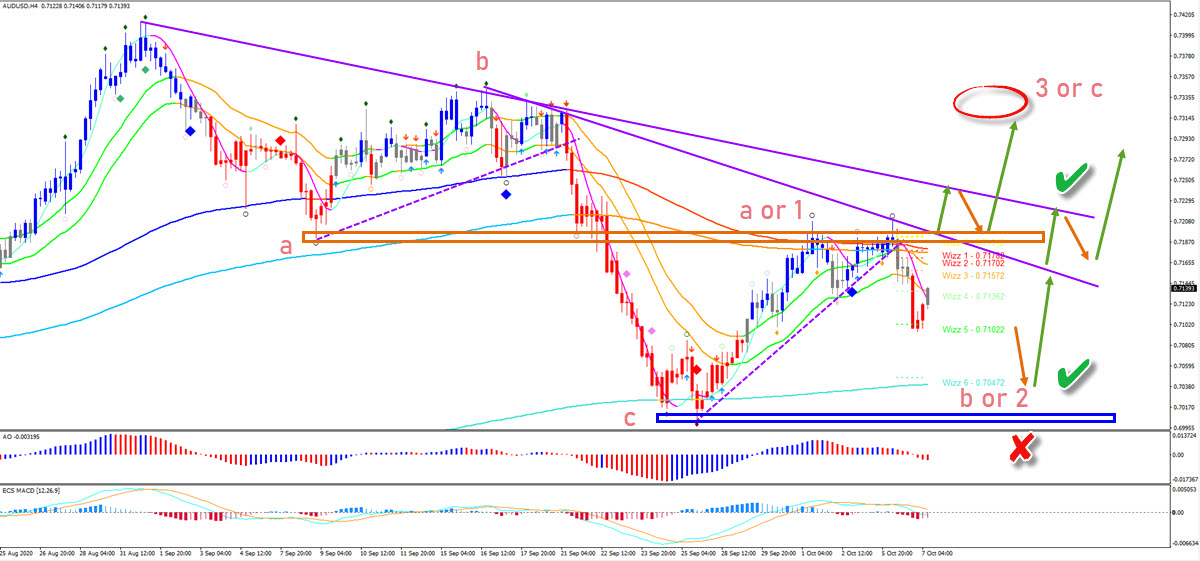
The 4 hour chart has seen multiple lower lows and lower highs. Price will first need to confirm a higher low before a reversal back up becomes probable. A breakout above the resistance box (orange) and trend lines (purple) would solidify the control of the bulls. The main question remains whether price is developing an ABC or 123 wave pattern but this will depend on how far price pushes up. A push into the red circle is typical for a wave C whereas a move above that makes a wave 3 more likely.
The analysis has been done with the indicators and template from the SWAT method (simple wave analysis and trading). For more daily technical and wave analysis and updates, sign-up to our newsletter.
Good trading,
Chris Svorcik


Leave a Reply