Weekly Waves 6 June: EUR/USD, US30 and Bitcoin
June 7, 2022
5 min read
Subscribe
Hi Traders,
Our weekly Elliott Wave analysis reviews the EUR/USD 4 hour chart, the Bitcoin crypto currency 4 hour chart, and the US30 monthly chart.
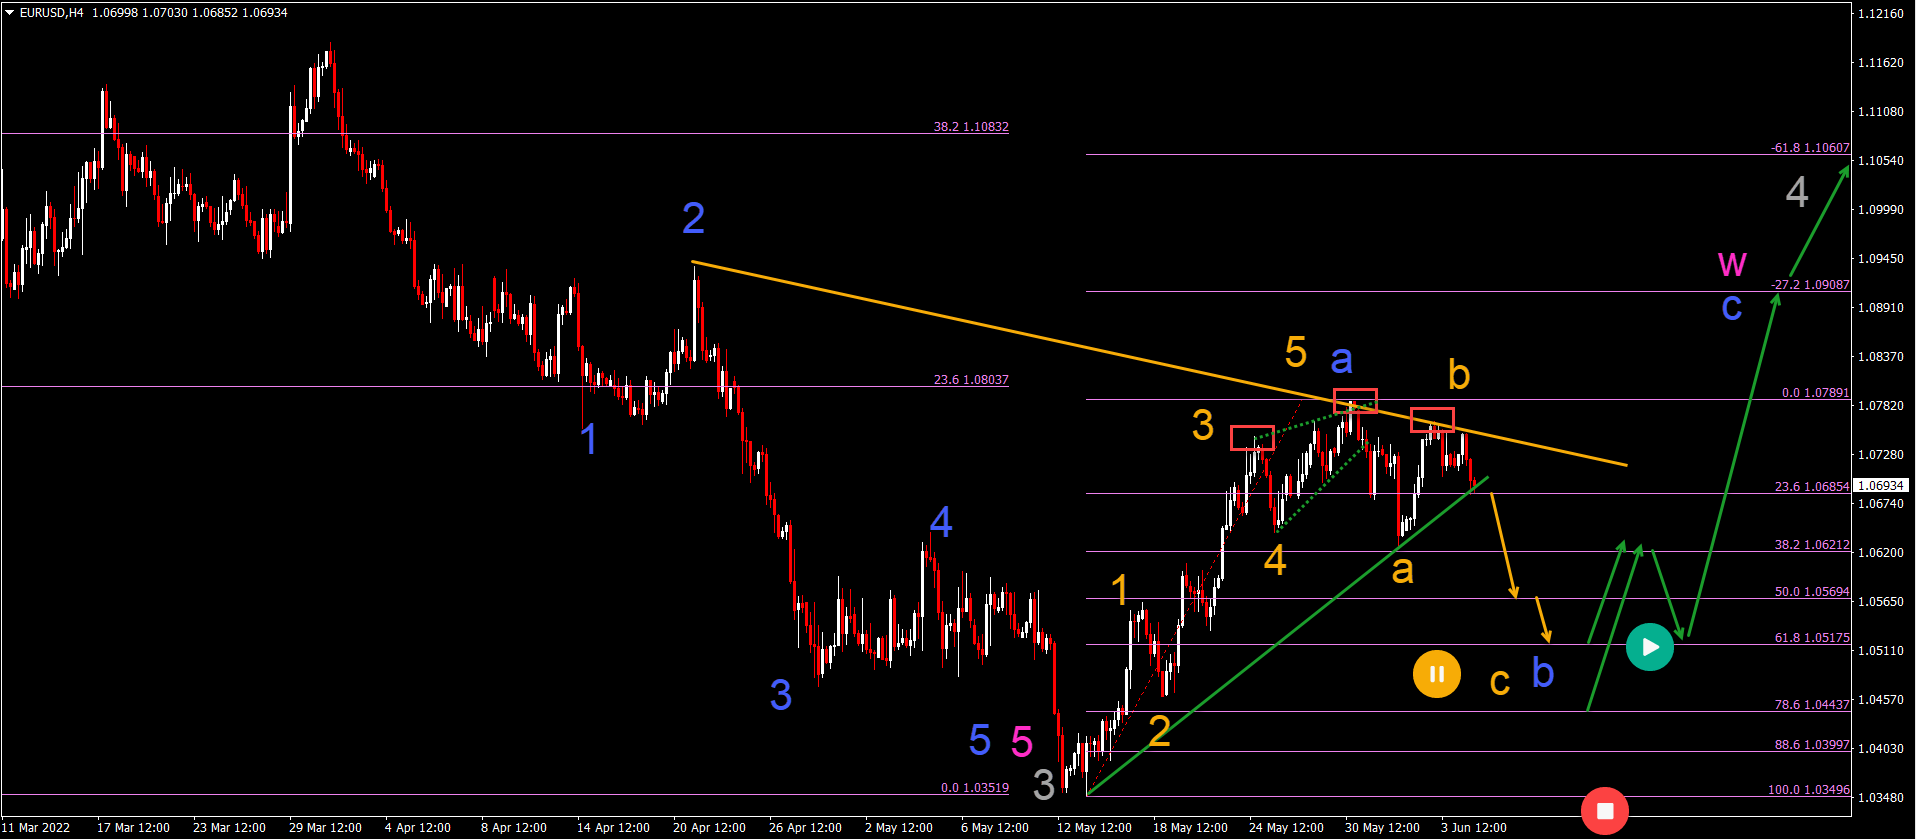
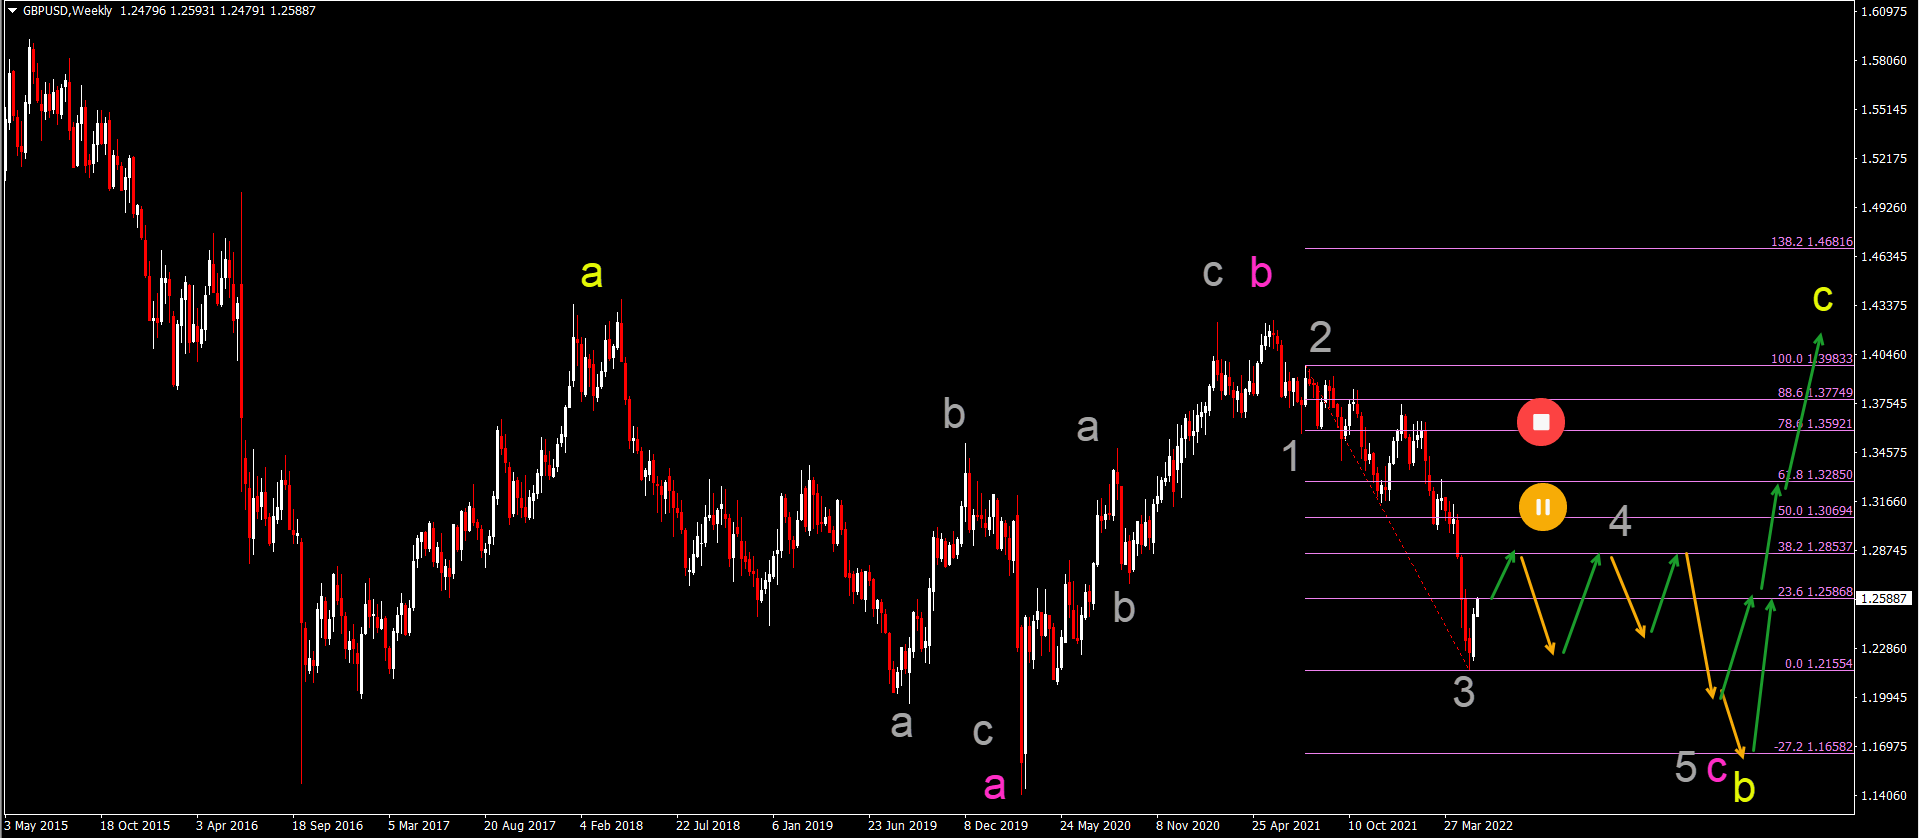
EUR/USD Bearish Zigzag Testing Key Fibonacci Support
The EUR/USD reached the 23.6% Fibonacci retracement level at 1.0790. But the price action was unable to break above that resistance zone:
- The EUR/USD bearish bounce indicates that the bullish price swing has completed a 5 wave (orange) pattern within wave A (blue).
- Price action has made a lower high at the resistance line (orange). This could confirm a bearish ABC (orange) pattern in wave B (blue).
- A breakout below the support trend line (green) would confirm the bearish breakout (orange arrows) towards the Fibonacci support levels.
- A bullish bounce at the Fib levels (green arrows) indicates a larger ABC bullish zigzag pattern (blue).
- The ABC (blue) is probably part of a larger wave W (pink) of a larger WXY in wave 4 (gray).
- A break below the 61.8% Fibonacci makes the zigzag pattern slightly less likely. A break below the 88.6% makes it very unlikely and a break below the bottom invalidates it.
ATHENA EA
#H1
#H4
#Time frames
Award Winning Momentum TradingPromo
Yearly Target:
220%
Risk/Reward:
0.36
Platforms:
MT4
Historical Drawdown:
30%
Min. Deposit:
50$
Asset Types:
Forex

Presented by
Chris Svorcik
Verified on:
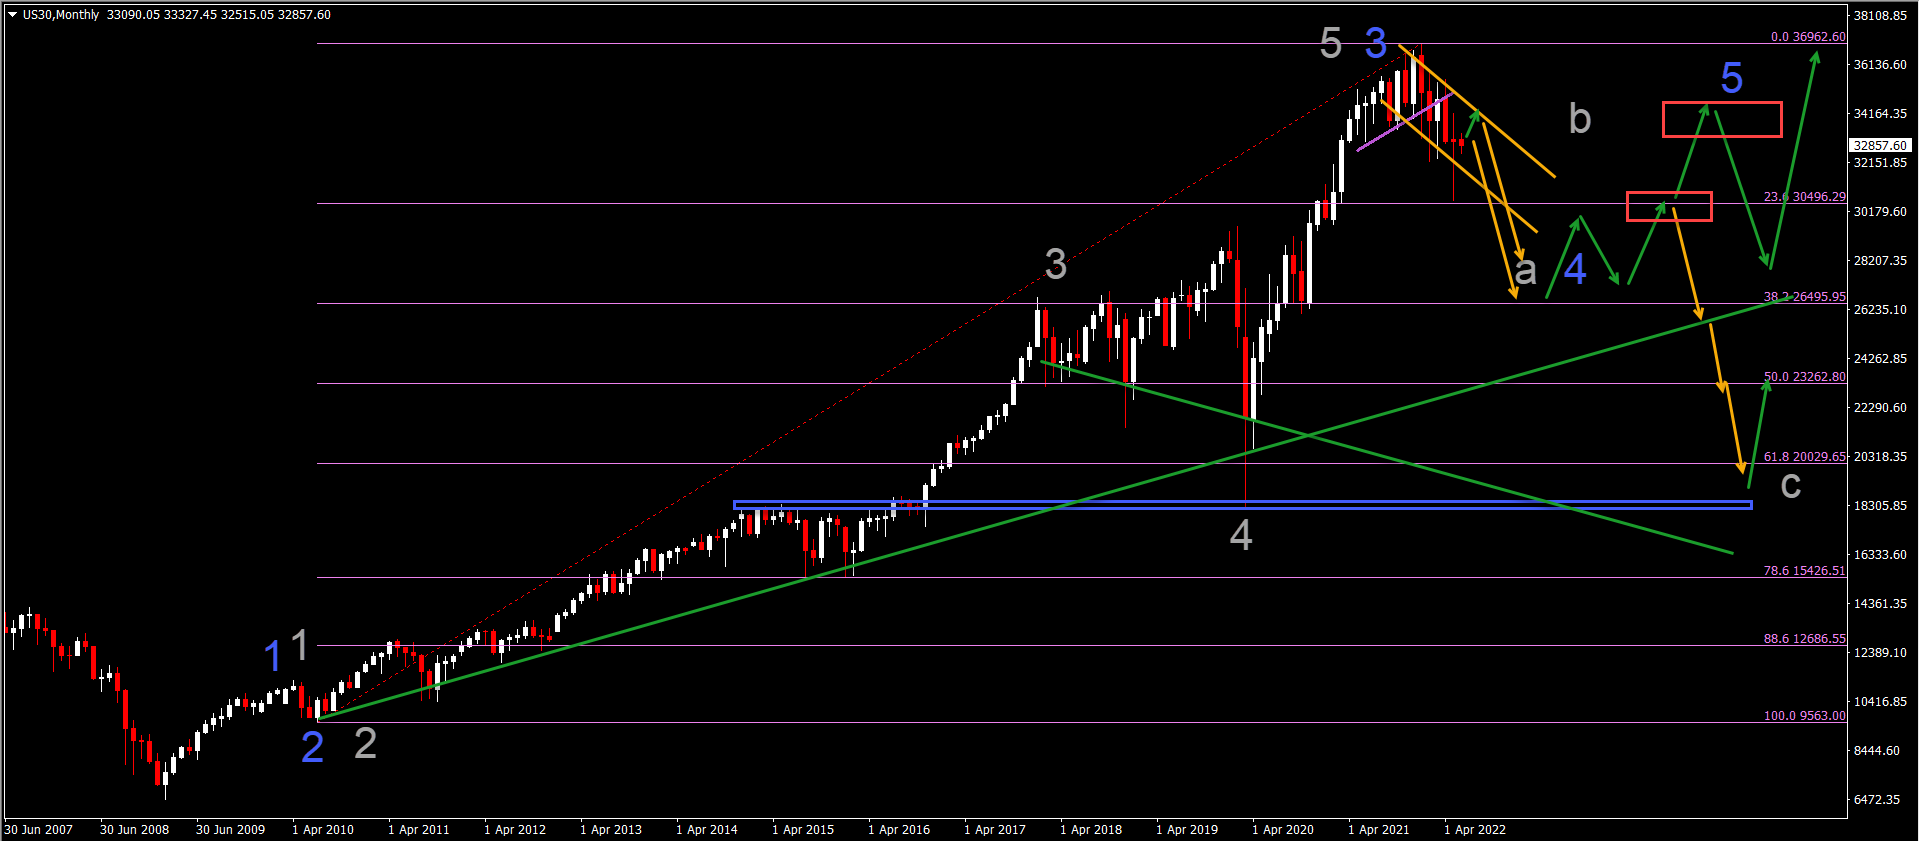
US30 Preparing for Large Bearish Correction
The US30 is started to unfold in a bearish pattern, just as we expected months ago:
- The monthly candles are showing a series of lower lows and lower highs of the monthly candles.
- The bearish correction stopped at the 23.6% Fibonacci retracement level.
- This analysis offers 2 main scenarios: 5 waves have been completed (gray) or 5 waves are still going to be completed (blue).
- In our view, the probability of a bearish pressure is much larger and a bearish correction via an ABC pattern (gray) is much more likely.
- The bearish correction could retrace as deep as the support zone (blue box) and 61.8% Fibonacci level throughout 2022 and 2023.
- The resistance zones (red) are key for a bearish bounce or bullish breakout.
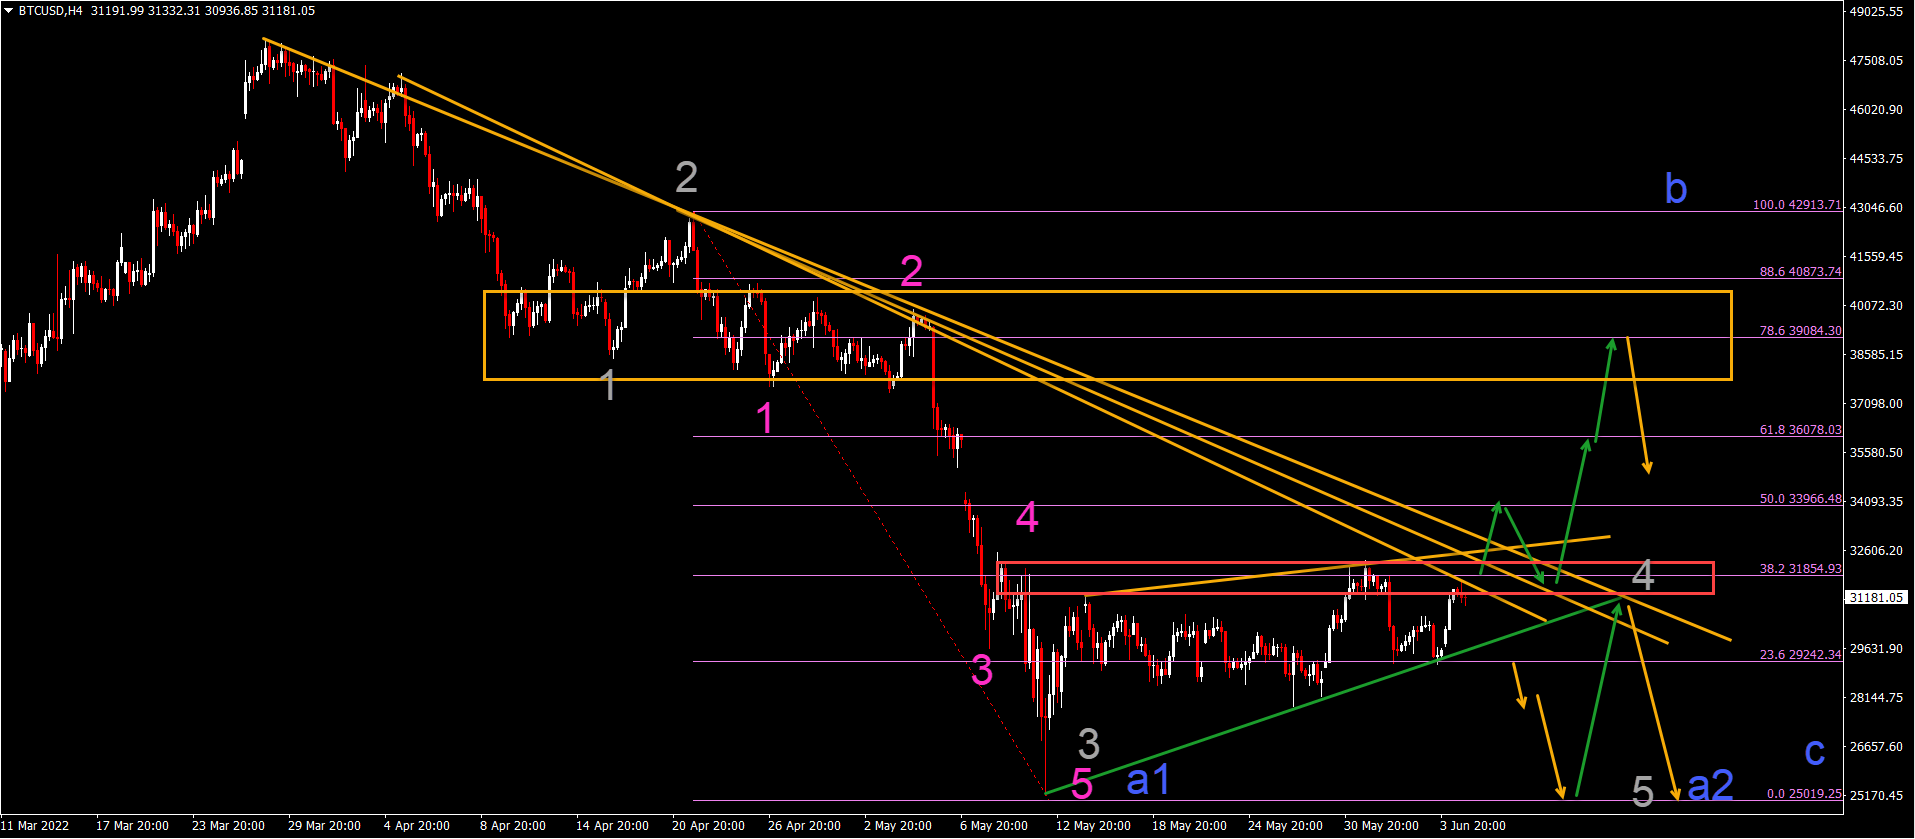
BTC/USD Critical Breakout Up or Down
Bitcoin (BTC/USD) has reached a key decision zone for a bearish or bullish breakout:
- The BTC/USD needs a breakout (green arrows) above the 38.2% Fibonacci retracement level, resistance trend lines (orange), and resistance zone (red box) for a bullsh revival.
- A bearish breakout (orange arrows) below the support lines (green) could indicate a continuation of the downtrend.
- A bullish scenario is shown by the pink waves indicating a 5 wave pattern (pink) has completed within wave A1 (blue)
- A bearish scenario is indicated by the gray waves indicating that one more lower low could be expected within wave A2 (blue).
- Eventually a larger ABC (blue) correction is expected to unfold. The bullish trend would be within a wave b (blue), either now or after a lower low.
Good trading,
Chris Svorcik


Leave a Reply