Weekly Waves 26 September: EUR/USD, GBP/USD and Bitcoin
September 26, 2022
4 min read

Hi Traders,
Our weekly Elliott Wave analysis reviews the EUR/USD 1 hour chart, the GBP/USD 1 hour chart, and the Bitcoin crypto currency daily chart.
EUR/USD Bearish Impulse Takes a Small Break
The EUR/USD almost reached 0.95 in early trading this morning:
- The EUR/USD could have completed wave 5 (green) of wave 3 (orange).
- The strong bullish bounce once price action reached the strong support at the 0.95 round level probably is a wave A (green) retracement.
- Price action could face difficulties to move much higher. The Fibonacci retracement levels should act as a strong resistance.
- A bearish reaction at the Fibonacci levels could confirm the end of wave A and the start of wave B (green).
- A larger ABC (green) pattern would fit within an expected wave 4 (orange).
- A downtrend is expected to resume and take price action at 0.94 and 0.9250 within wave 5 (orange) of waves 3.

ATHENA EA
#H1
#H4
#Time frames
Award Winning Momentum TradingPromo
Yearly Target:
220%
Risk/Reward:
0.36
Platforms:
MT4
Historical Drawdown:
30%
Min. Deposit:
50$
Asset Types:
Forex

Presented by
Chris Svorcik
Verified on:
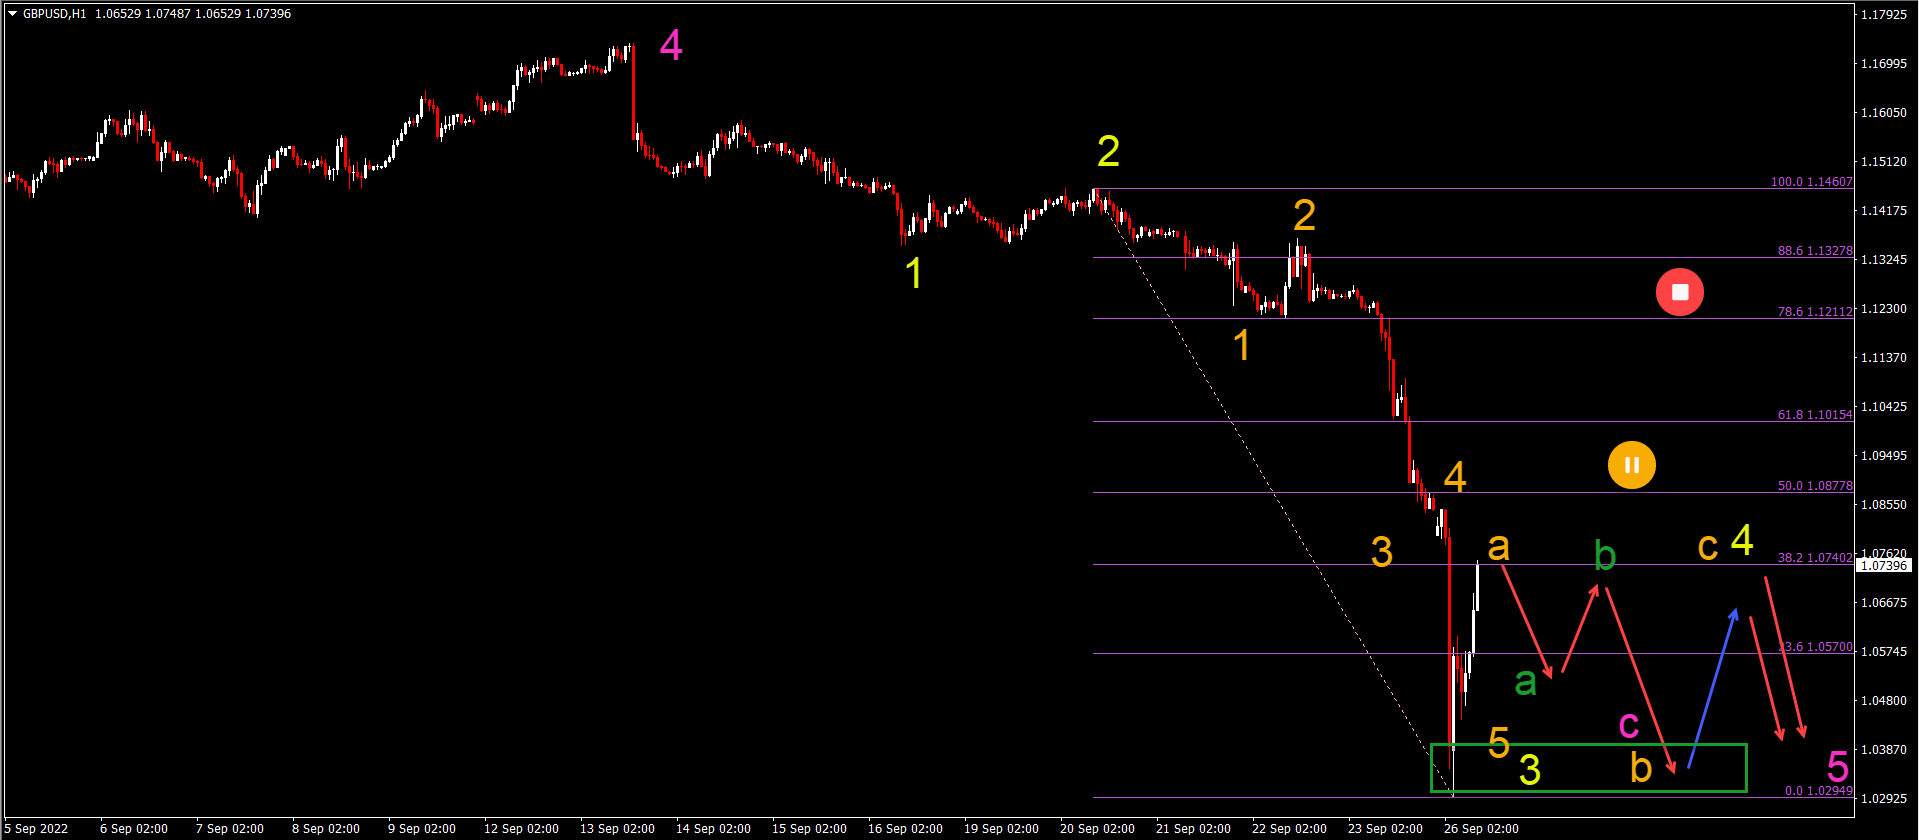
GBP/USD Crashes 550 Pips in Early Trading
The GBP/USD made a huge drop from 1.0850 down to 1.03 earlier this morning:
- The GBP/USD 550 pip decline this morning seems to be part of an impulsive wave 3 (yellow).
- The strong bullish push upwards after the decline is expected to be a wave A (orange) of a larger ABC (orange) within a wave 4 (yellow).
- The Fibonacci levels are expected to be a resistance zone.
- A break above the 50% Fibonacci level makes it less likely that the current Elliott Wave analysis – indicating a wave 3 and 4 (yellow) – is correct.
- A bullish ABC (orange) is expected within the wave 4 (yellow).
- A downtrend continuation should aim at parity (1.00).
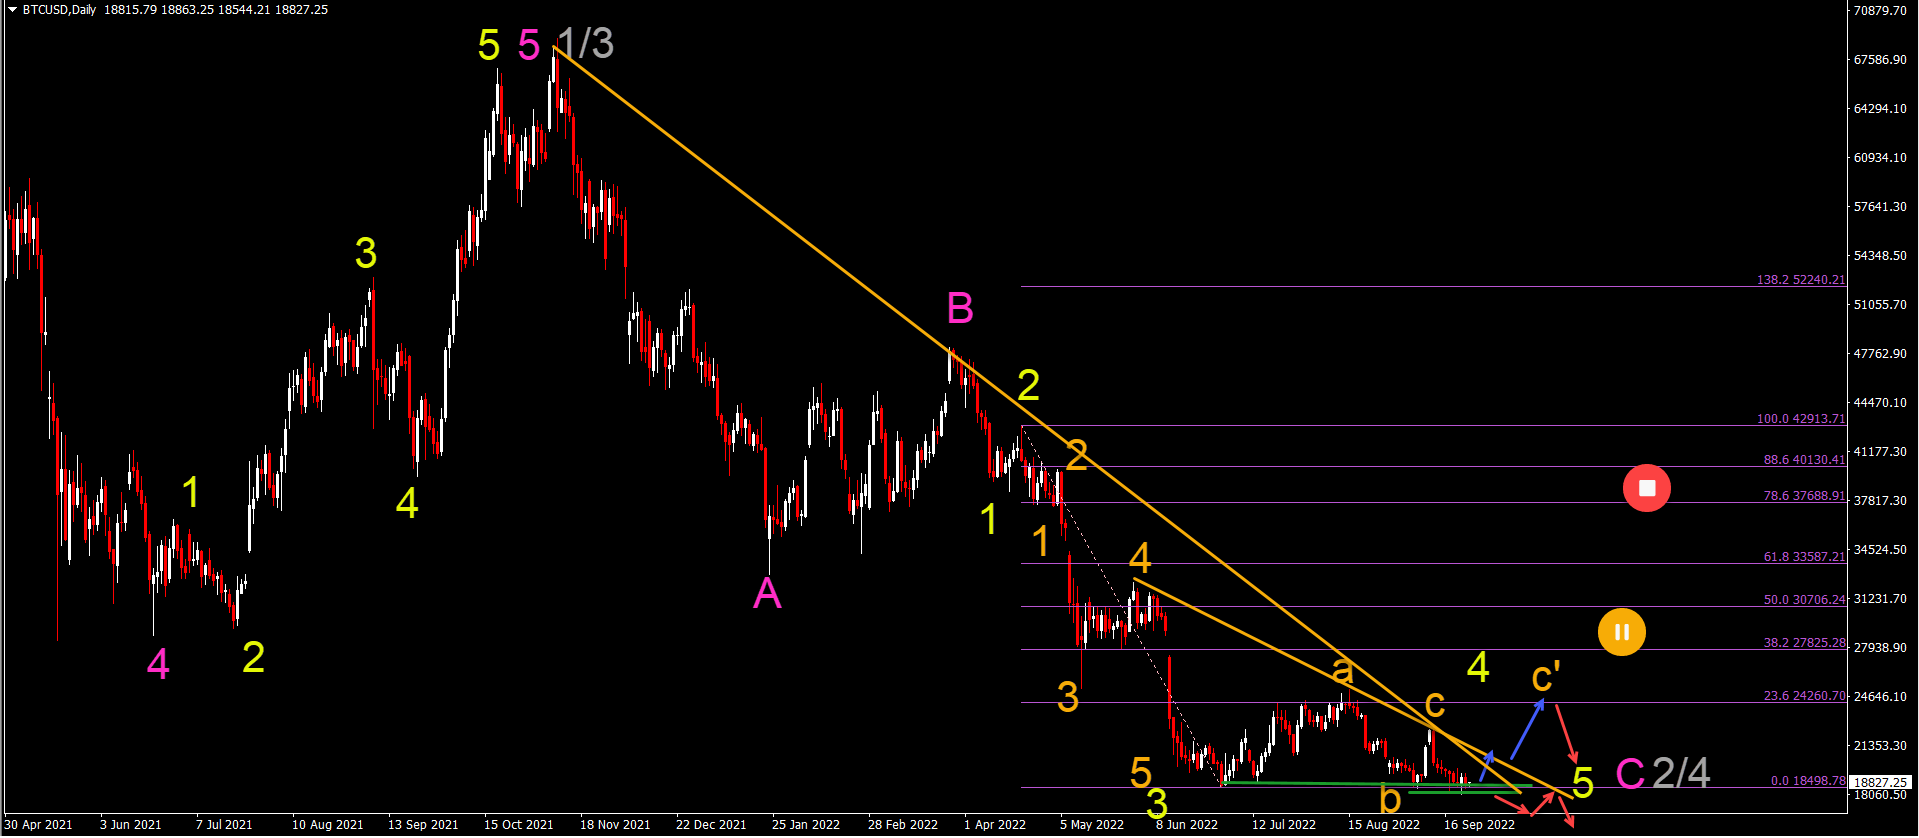
BTC/USD
Bitcoin (BTC/USD) is unable to break through the previous bottom (green lines):
- The BTC/USD is at an important decision zone: a bearish breakout confirms the downtrend (red arrows).
- A bullish bounce (blue arrows) could indicate a larger wave C (orange C’) towards the 23.6% and 38.2% Fibonacci resistance zone.
- A break above the 38.2-50% Fibonacci levels could indicate that the wave 5 (yellow) of wave C (pink) has been completed.
- A bearish bounce at the Fibonacci resistance levels should signal the end of the wave 4 (yellow).
- downtrend continuation aims at $15k and $12.5k within wave C (pink).
Good trading,
Chris Svorcik


Leave a Reply