? XAU/USD Completes Bullish Wave-A & Starts Bearish Wave-B ? ?
Subscribe
Hi traders,
Gold (XAU/USD) is either building a retracement within the uptrend or price is ready for a bearish reversal back to $1250. For the moment, price stopped at the 38.2% Fibonacci retracement level of wave 4 vs 3, which is an usual Fib level for a wave 4 (orange). The breakout direction above the resistance trend line (red) or below the support trend line (blue) will decide about the next expected price swing.
XAU/USD
4 hour
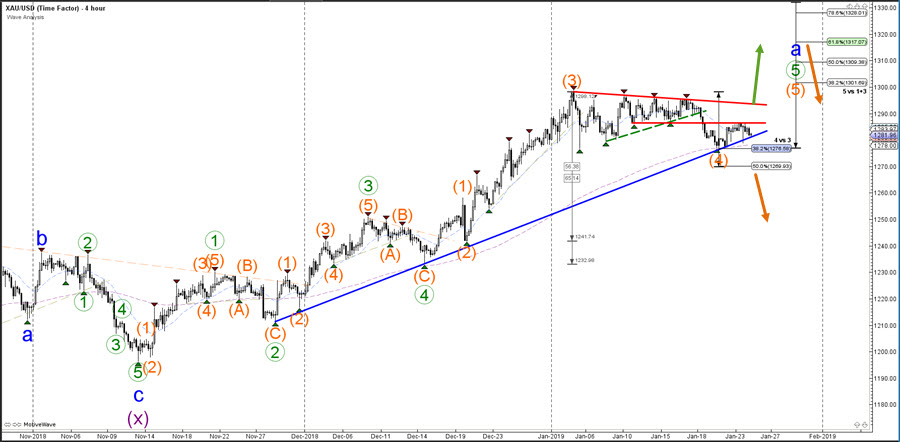
XAU/USD has either completed a wave A (blue) at the most recent top or price will expand the wave A and a new higher high will emerge. Gold will need to break above the resistance zone (red lines) before a bullish break towards $1320 is possible whereas a deeper bearish retracement can only happen if price is able to break below the 50% Fib.
Daily
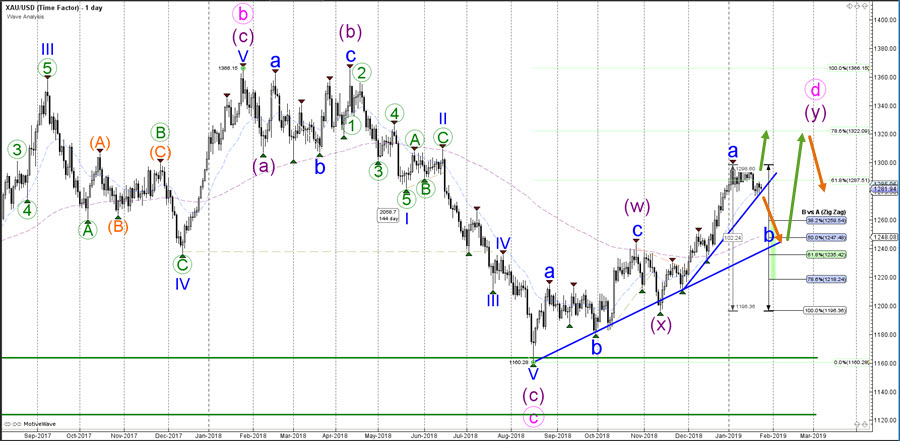
XAU/USD seems to be completing a bullish ABC (blue) zigzag pattern. The wave pattern is probably part of a larger ABCDE (pink) triangle chart pattern. Once price completes wave D (pink), then an ABC retracement is expected within the final wave E. A break above the 100% Fibonacci level invalidates the expected wave D pattern.
For more daily wave analysis and updates, sign-up up to our ecs.LIVE channel.
Good trading,
Chris Svorcik
Elite CurrenSea


Leave a Reply