? What’s Next for Gold After $250 Drop to 50% Fib? ?

Dear traders,
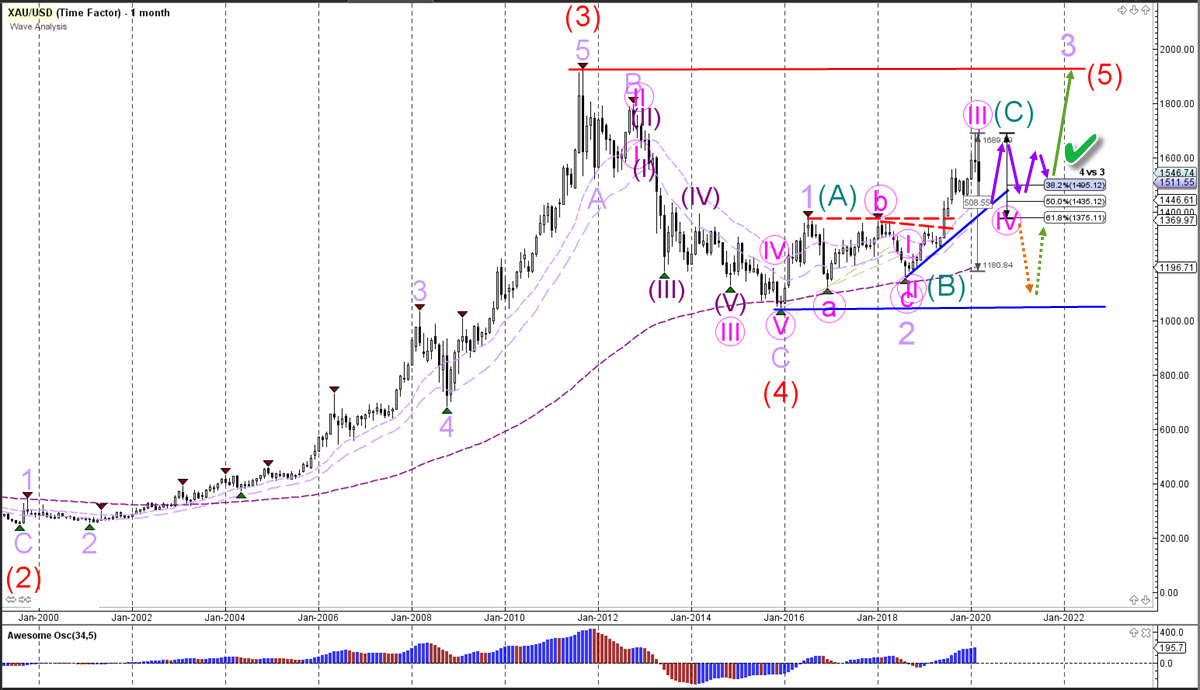
Gold (XAU/USD) is in an uptrend after breaking above the key resistance zone (dotted red). The main question is whether price is in a wave 3 (pink) or ABC pattern (green-blue).
XAU/USD
Monthly chart
The XAU/USD will decide about its long-term path at the Fibonacci levels of wave 4 vs 3 (pink). A break below the 61.8% Fib confirms an ABC pattern up and an ABC pattern down towards the previous bottom (blue line). A bounce at the Fibs however could be used for a rally higher (green arrow). The main target is the previous top (red line).
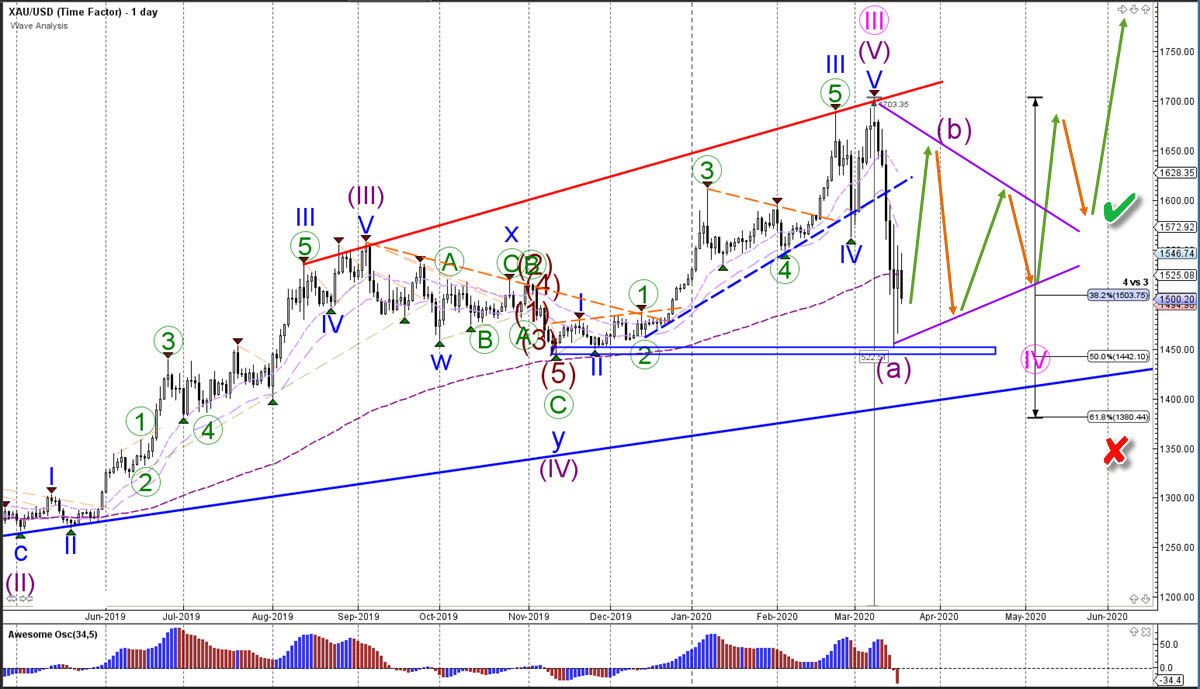
Daily chart
The XAU/USD made a strong push up. But also a strong decline. This probably completes a wave 3 (pink). The current pullback could be a wave 4 (pink). This is more likely if price action is building a triangle pattern via ABCDE. A break below the 50-61.8% Fibs however invalidates (red x) the wave 4 (pink). A bearish breakout confirms the ABC patterns mentioned in the monthly chart.
The analysis has been done with SWAT method (simple wave analysis and trading).
For more daily technical and wave analysis and updates, sign-up up to our newsletter.
Good trading,
Chris Svorcik
Elite CurrenSea


Leave a Reply