? USD/JPY Bullish Reversal After Hitting 61.8% Golden Ratio ?

Dear traders,
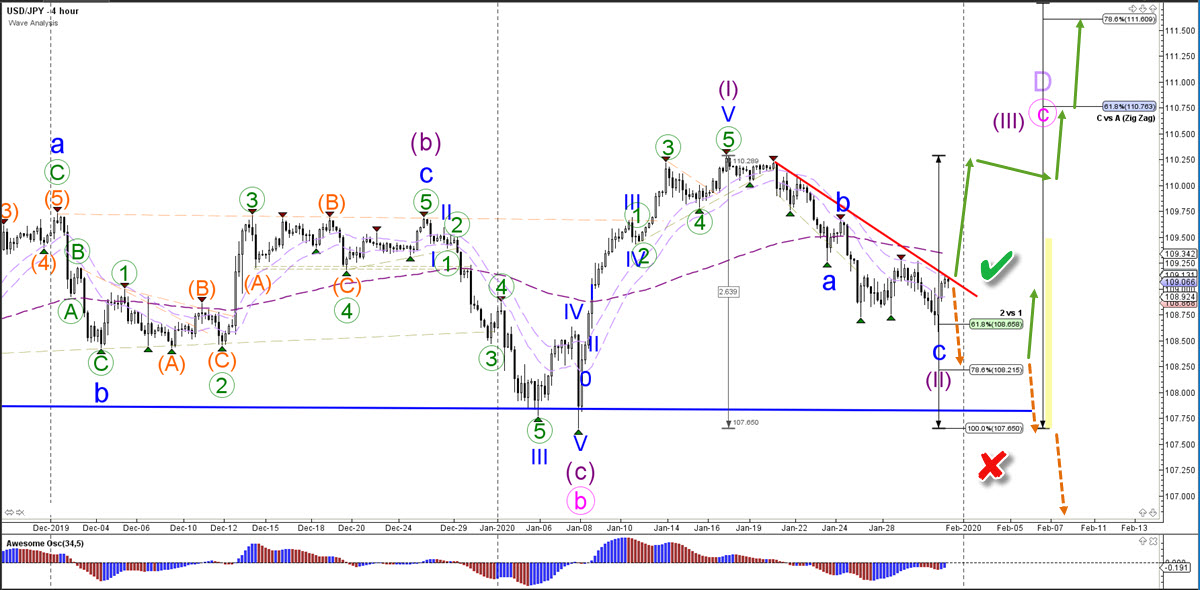
the USD/JPY made a bullish bounce at the 61.8% Fibonacci retracement level, which could complete an ABC (blue) pattern of the wave 2 (purple) retracement.
USD/JPY
4 hour
The USD/JPY needs to break above the resistance trend line (red) to confirm the end of the wave 2 (purple). A push above the resistance trend line could also confirm the start of a potential wave 3 (purple) pattern towards the Fibonacci targets of wave C vs A. A break below the 100% Fibonacci level of wave 2 vs 1 invalidates (red x) the current wave 1-2 pattern.
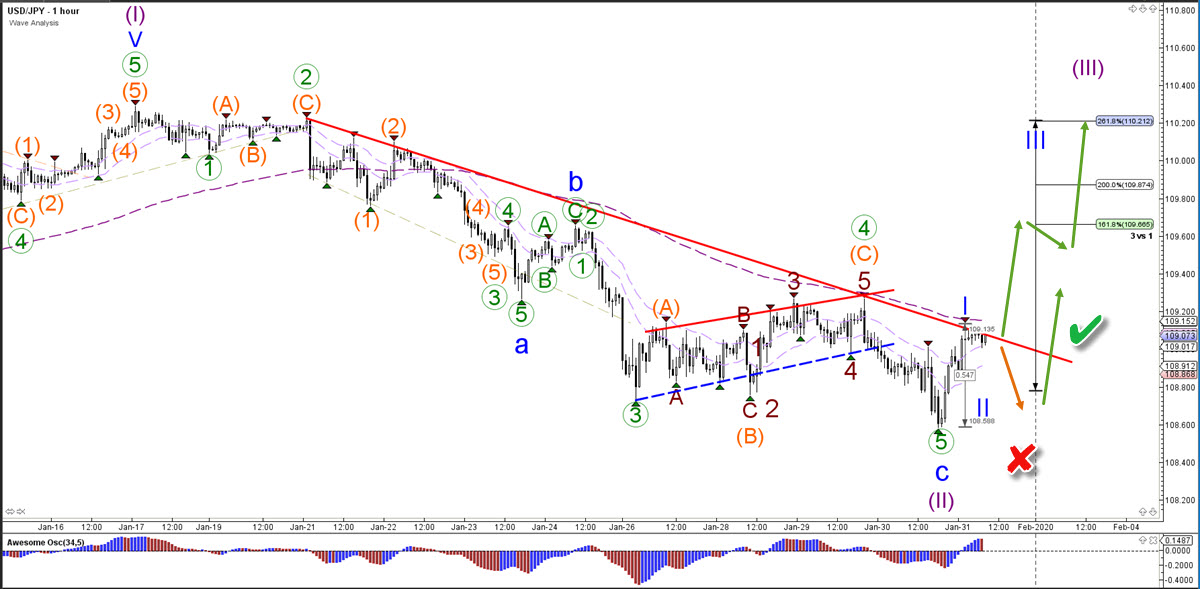
1 hour
The USD/JPY bear flag indeed turned out to be wave 4 (green) pattern. The bounce at the resistance (red) and break below support (dotted blue) confirmed the expected wave 4-5 (green) pattern. The bullish bounce now suggests a potential wave 1-2 (blue) reversal pattern as long as price action stays above the bottom of wave 1 (blue) otherwise it would become invalidated (red x).
The analysis has been done with SWAT method (simple wave analysis and trading).
For more daily wave analysis and updates, sign-up up to our ecs.LIVE channel.
Good trading,
Chris Svorcik
Elite CurrenSea


Leave a Reply