? USD/JPY Bullish Price Action Is Wave 4 Pullback in Downtrend ?
Subscribe
Dear traders,
the USD/JPY is building a pullback after strong bearish momentum broke below the short and long-term moving averages, which seems to be a bearish wave C (purple).
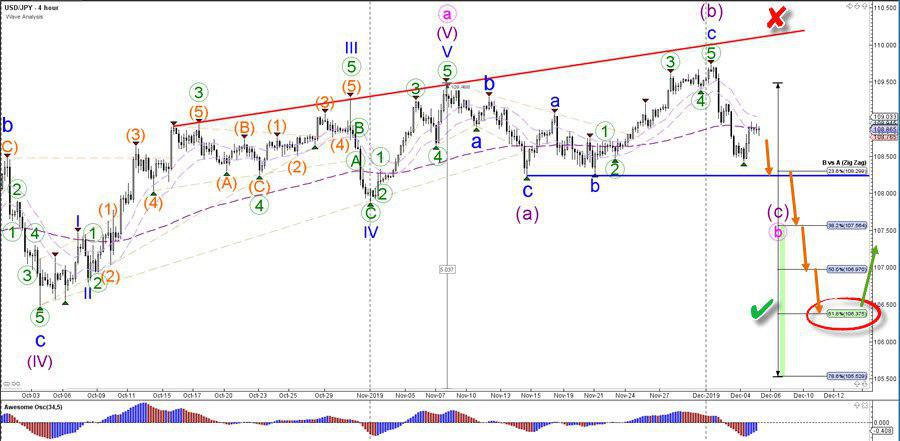
USD/JPY
4 hour
The USD/JPY is probably building a bearish ABC (purple) flat correction as part of a wave B (pink) of a larger ABC zigzag (pink) pattern. The main target of the wave C (purple) of wave B (pink) is the 61.8% Fibonacci retracement level (red circle) of wave B vs A. A bullish bounce (green check) could confirm this outlook whereas a break above the resistance trend line (red) invalidates (red x) it.

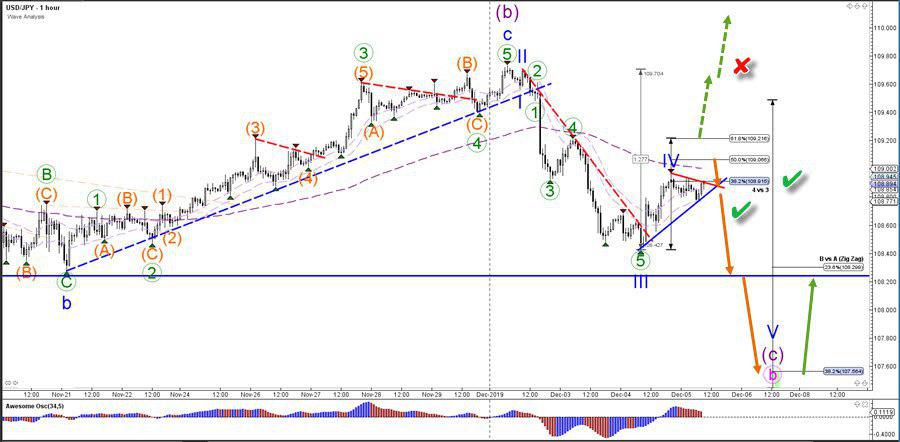
1 hour
The USD/JPY bearish momentum is probably a wave 5 (green) pattern of a wave 3 (blue). The current pullback is likely a wave 4 pullback (blue) and the Fibonacci levels of wave 4 vs 3 are likely to be resistance levels, which could create a bearish bounce and breakout (green checks). A bearish continuation is aiming for the 38.2% Fib if not lower (see 4 hour chart) whereas a break above the 61.8% Fib makes the current wave outlook less likely (red x).

For more daily wave analysis and updates, sign-up up to our ecs.LIVE channel.
Good trading,
Chris Svorcik
Elite CurrenSea


Leave a Reply