? USD/JPY Bull Flag Chart Pattern Offers Target at 111.75 ?
Subscribe
Hi traders,
The USD/JPY continued with the uptrend yesterday and showed another higher high at 111.50. Price is now building a new bearish retracement as price broke below the steep trend line (dotted blue).
USD/JPY
4 hour
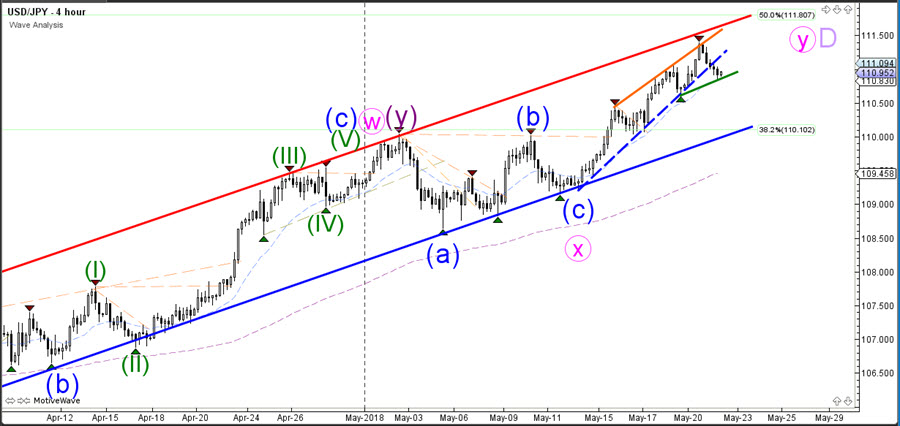
Price has now more space towards the top of uptrend channel (red) and 50% Fibonacci retracement level which could be a potential bouncing spot as part of a larger WXY (pink) correction within wave D (purple).

1 hour 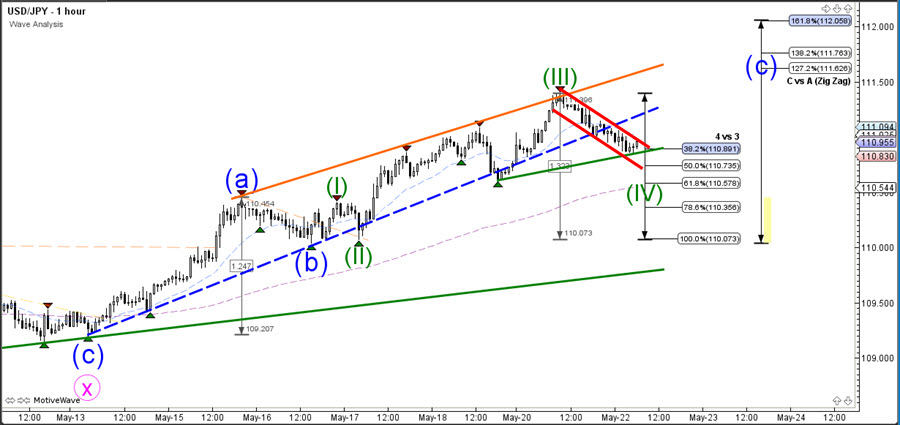
The USD/JPY seems to have completed a wave 3 (green) momentum and price could be building a bearish retracement within wave 4 (green). A bullish bounce within wave 4 (green) is likely if price stays above the 61.8% Fibonacci level. A bullish breakout above the bull flag pattern (red lines) could soon start a bullish wave 5 continuation within wave C (blue) towards the Fibonacci targets.
Good trading,
Chris Svorcik
Elite CurrenSea
.


Leave a Reply