? USD/JPY Builds ABC Flat Correction Before 110 Resistance ?

Dear traders,
the USD/JPY is building a bearish pullback at the previous top (red), which is a key decision zone for a bullish break or bearish reversal.
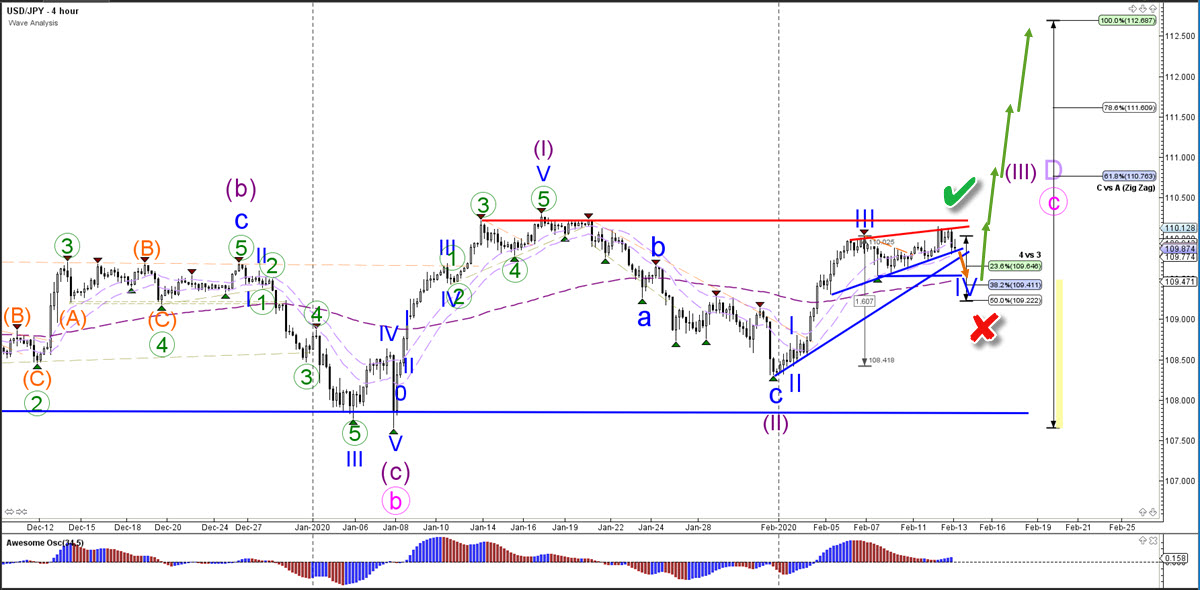
USD/JPY
4 hour
The USD/JPY was unable to break the top and resistance (red) with its first breakout attempt. Price is now retracing back to the Fibonacci levels of wave 4 vs 3. A bearish break below the 50% invalidates (red x) the wave 4 (blue). A bullish break confirms (green check) the move up towards the Fibonacci targets.
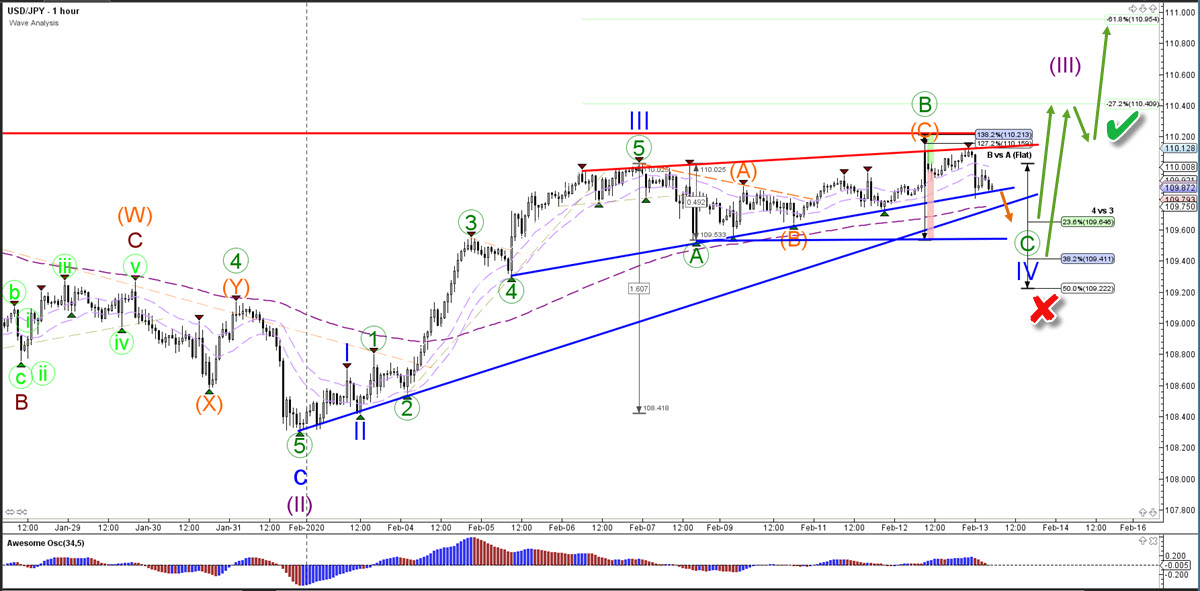
1 hour
The USD/JPY is building an ABC flat correction (green) within wave 4 (blue). The current wave C (green) is expected to finish at the Fibo levels of wave 4 (blue). A break below the 50% (red x) indicates a different wave count.
The analysis has been done with SWAT method (simple wave analysis and trading).
For more daily wave analysis and updates, sign-up up to our ecs.LIVE channel.
Good trading,
Chris Svorcik
Elite CurrenSea


Leave a Reply