? USD/JPY Builds ABC Flat Correction and Aims at 107 ?
Subscribe
Hi traders,
the USD/JPY made a bullish bounce at the previous bottom, which could indicate a wave 4 (green) pattern and correction. One more lower low remains likely for now.
USD/JPY
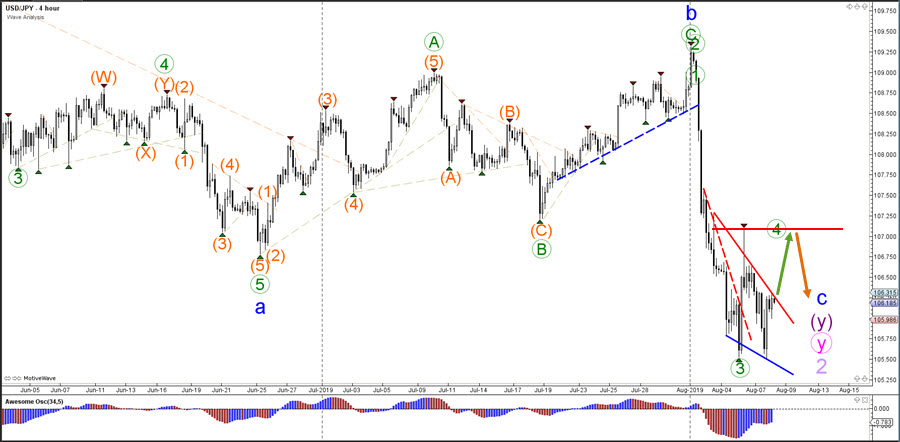
4 hour
The USD/JPY break above the resistance trend line (red) could indicate a push up towards the horizontal resistance level (red) at 107, which in turn could be a bouncing spot. The wave 2 (purple) pattern becomes invalid if price is able to break below the key support level at 104.75.
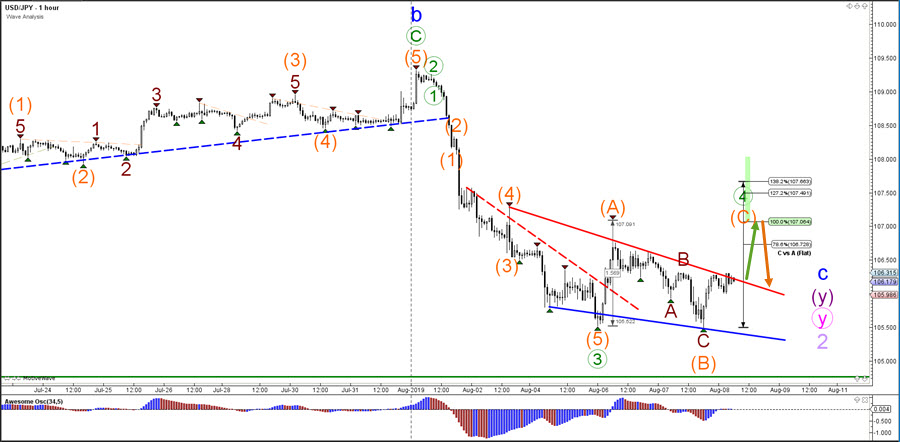
1 hour
The USD/JPY seems to have completed a bearish ABC (brown) within wave B (orange). A break above the resistance trend line (red) could indicate a bullish breakout towards the Fibonacci levels of wave C vs A.
For more daily wave analysis and updates, sign-up up to our ecs.LIVE channel.
Good trading,
Chris Svorcik Elite CurrenSea


Leave a Reply